
Quality characteristic type Attributes data Size of shift to detect ≥ 1.5σ | Rational subgroup size n > 1 Underlying distribution | |
 | ||
Measurement type Number of nonconformances per unit | ||
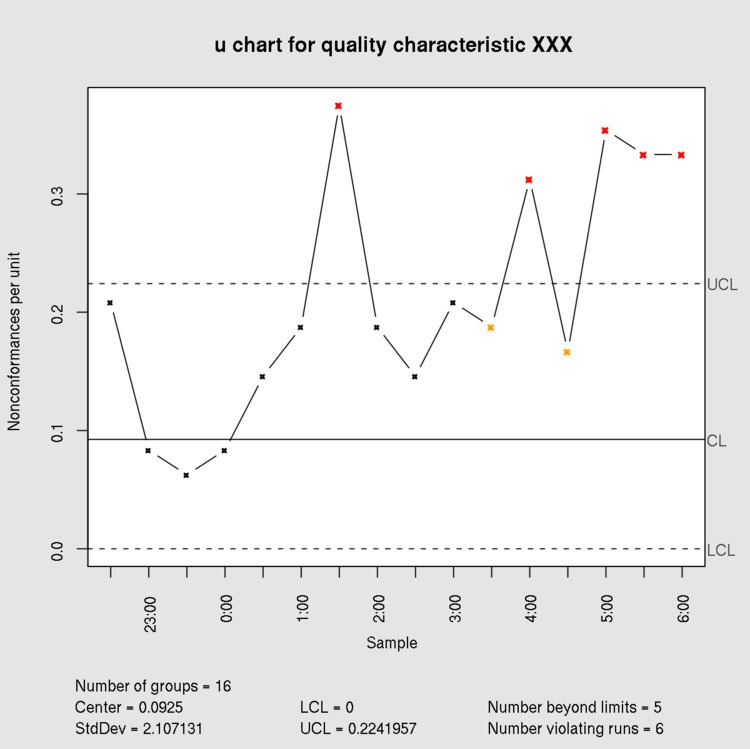
In statistical quality control, the u-chart is a type of control chart used to monitor "count"-type data where the sample size is greater than one, typically the average number of nonconformities per unit.
The u-chart differs from the c-chart in that it accounts for the possibility that the number or size of inspection units for which nonconformities are to be counted may vary. Larger samples may be an economic necessity or may be necessary to increase the area of opportunity in order to track very low nonconformity levels.
Examples of processes suitable for monitoring with a u-chart include:
As with the c-chart, the Poisson distribution is the basis for the chart and requires the same assumptions.
The control limits for this chart type are