
 | ||
The Atlantic Multidecadal Oscillation (AMO) is a climate cycle that affects the sea surface temperature of the North Atlantic Ocean based on different modes on multidecadal timescales. While there is some support for this mode in models and in historical observations, controversy exists with regard to its amplitude, and in particular, the attribution of sea surface temperature change to natural or anthropogenic causes, especially in tropical Atlantic areas important for hurricane development.
Contents
Definition
The Atlantic Multidecadal Oscillation (AMO) was identified by Schlesinger and Ramankutty in 1994.
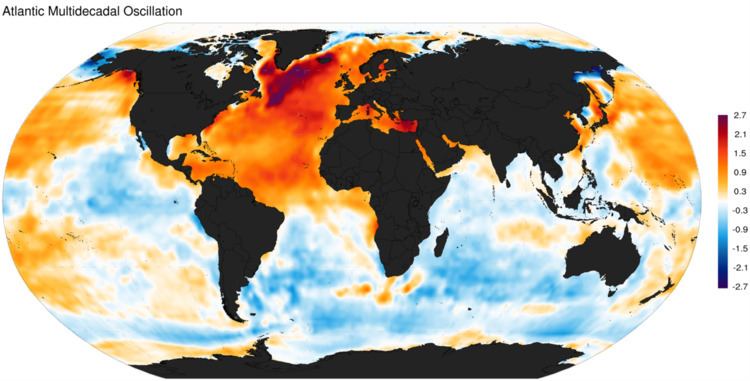
The AMO signal is usually defined from the patterns of SST variability in the North Atlantic once any linear trend has been removed. This detrending is intended to remove the influence of greenhouse gas-induced global warming from the analysis. However, if the global warming signal is significantly non-linear in time (i.e. not just a smooth linear increase), variations in the forced signal will leak into the AMO definition. Consequently, correlations with the AMO index may mask effects of global warming.
Several methods have been proposed to remove the global trend and ENSO influence over the North Atlantic SST. Trenberth and Shea, assuming that the effect of global forcing over the North Atlantic is similar to the global ocean, subtracted the global (60°N-60°S) mean SST from the North Atlantic SST to derive a revised AMO index.
Ting et al. however argue that the forced SST pattern is not spatially uniform; they separated the forced and internally generated variability using signal to noise maximizing EOF analysis.
Van Oldenborgh et al. derived an AMO index as the SST averaged over the extra-tropical North Atlantic (to remove the influence of ENSO that is greater at tropical latitude) minus the regression on global mean temperature.
Guan and Nigam removed the non stationary global trend and Pacific natural variability before applying an EOF analysis to the residual North Atlantic SST.
The linearly detrended index suggests that the North Atlantic SST anomaly at the end of the twentieth century is equally divided between the externally forced component and internally generated variability, and that the current peak is similar to middle twentieth century; by contrast the others methodology suggest that a large portion of the North Atlantic anomaly at the end of the twentieth century is externally forced.
Mechanisms
In models, AMO-like variability is associated with small changes in the North Atlantic branch of the Thermohaline Circulation. However, historical oceanic observations are not sufficient to associate the derived AMO index to present-day circulation anomalies. Models and observations indicate that changes in atmospheric circulation, which induce changes in clouds, atmospheric dust and surface heat flux, are largely responsible for the tropical portion of the AMO.
The Atlantic Multidecadal Oscillation (AMO) is important for how external forcings are linked with North Atlantic SSTs.
Climate impacts worldwide
The AMO index is correlated to air temperatures and rainfall over much of the Northern Hemisphere, in particular in the summer climate in North America and Europe. Through changes in atmospheric circulation, the AMO can also modulate spring snowfall over the Alps and glaciers' mass variability. Rainfall patterns are affected in North Eastern Brazilian and African Sahel. It is also associated with changes in the frequency of North American droughts and is reflected in the frequency of severe Atlantic hurricane activity.
Recent research suggests that the AMO is related to the past occurrence of major droughts in the US Midwest and the Southwest. When the AMO is in its warm phase, these droughts tend to be more frequent or prolonged. Two of the most severe droughts of the 20th century occurred during the positive AMO between 1925 and 1965: The Dust Bowl of the 1930s and the 1950s drought. Florida and the Pacific Northwest tend to be the opposite—warm AMO, more rainfall.
Climate models suggest that a warm phase of the AMO strengthens the summer rainfall over India and Sahel and the North Atlantic tropical cyclone activity. Paleoclimatologic studies have confirmed this pattern—increased rainfall in AMO warmphase, decreased in cold phase—for the Sahel over the past 3,000 years.
Relation to Atlantic hurricanes
In viewing actual data on a short time horizon, sparse experience would suggest the frequency of major hurricanes is not strongly correlated with the AMO. During warm phases of the AMO, the number of minor hurricanes (category 1 and 2) saw a modest increase. With full consideration of meteorological science, the number of tropical storms that can mature into severe hurricanes is much greater during warm phases of the AMO than during cool phases, at least twice as many; the AMO is reflected in the frequency of severe Atlantic hurricanes. The hurricane activity index is found to be highly correlated with the Atlantic multidecadal oscillation. If there is an increase in hurricane activity connected to global warming, it is currently obscured by the AMO quasi-periodic cycle. The AMO alternately obscures and exaggerates the global increase in temperatures due to human-induced global warming. Based on the typical duration of negative and positive phases of the AMO, the current warm regime is expected to persist at least until 2015 and possibly as late as 2035. Enfield et al. assume a peak around 2020.
The recent AMO increased the average number of Atlantic hurricanes and named storms from 6 to 12, when it began in 1995.
Florida rainfall
The AMO has a strong effect on Florida rainfall. Rainfall in central and south Florida becomes more plentiful when the Atlantic is in its warm phase and droughts and wildfires are more frequent in the cool phase. As a result of these variations, the inflow to Lake Okeechobee—the reservoir for South Florida’s water supply—changes by as much as 40% between AMO extremes. In northern Florida the relationship begins to reverse—less rainfall when the Atlantic is warm.
Periodicity and prediction of AMO shifts
There are only about 130–150 years of data based on instrument data, which are too few samples for conventional statistical approaches. With the aid of multi-century proxy reconstruction, a longer period of 424 years was used by Enfield and Cid–Serrano as an illustration of an approach as described in their paper called "The Probabilistic Projection of Climate Risk". Their histogram of zero crossing intervals from a set of five re-sampled and smoothed version of Gray et al. (2004) index together with the Maximum Likelihood Estimate gamma distribution fit to the histogram, showed that the largest frequency of regime interval was around 10–20 year. The cumulative probability for all intervals 20 years or less was about 70%.
There is no demonstrated predictability for when the AMO will switch, in any deterministic sense. Computer models, such as those that predict El Niño, are far from being able to do this. Enfield and colleagues have calculated the probability that a change in the AMO will occur within a given future time frame, assuming that historical variability persists. Probabilistic projections of this kind may prove to be useful for long-term planning in climate sensitive applications, such as water management.
Assuming that the AMO continues with its quasi-cycle of roughly 70 years, the peak of the current warm phase would be expected in c. 2020, or based on its 50–90 year quasi-cycle, between 2000 and 2040 (after peaks in c. 1880 and c. 1950).