
 | ||
Similar The Baseball Network, Major League Baseball, Monday Night Baseball, Major League Baseball, This Week in Baseball | ||
The highest average rating for an entire World Series is tied between the 1978 Series featuring the New York Yankees and Los Angeles Dodgers and the 1980 Series featuring the Philadelphia Phillies and Kansas City Royals. Both Series, each of which went six games, averaged a national rating of 32.8 and a share of 56. However, the 1978 Series had a slightly larger total viewership (44,278,950) than 1980 (42,300,000).
Contents
- Least and most viewed World Series 1984 present
- Viewership records for Games 17 1984 present
- Television ratings by year 1984 present
- References
The highest-rated individual game in Series history was Game 7 in 1986, as the New York Mets defeated the Boston Red Sox at Shea Stadium in New York City. The game had a 38.9 national rating and a 55 share. This broke the record established two nights before, in which 52% of televisions in use in the US were tuned in to see the Mets' famous Game 6 comeback that forced a Game 7.
The lowest-rated World Series game came in 2008, as only 9.836 million people watched Game 3 between the Philadelphia Phillies and the Tampa Bay Rays; a rain delay moved the start of the game to after 10 p.m. on the East Coast with the game not ending until 1:47 a.m. It had an all-time low rating of 6.1, matched later by Game 3 in 2012 between the San Francisco Giants and the Detroit Tigers.
The least-watched World Series was in 2012, a four-game sweep of the Detroit Tigers by the San Francisco Giants that averaged a 7.6 rating and 12 share.
Game 7 of the 2016 World Series between the Chicago Cubs and Cleveland Indians saw the highest rating in 25 years, averaging 40 million viewers and more than 75 million viewers saw all or part of the game.
Least and most viewed World Series, 1984 – present
The following shows the World Series with the lowest and highest average viewership. Figures are in millions.
Viewership records for Games 1–7, 1984 – present
The following table shows the viewership records — both highest and lowest — for games one through seven in a World Series. Figures are in millions.
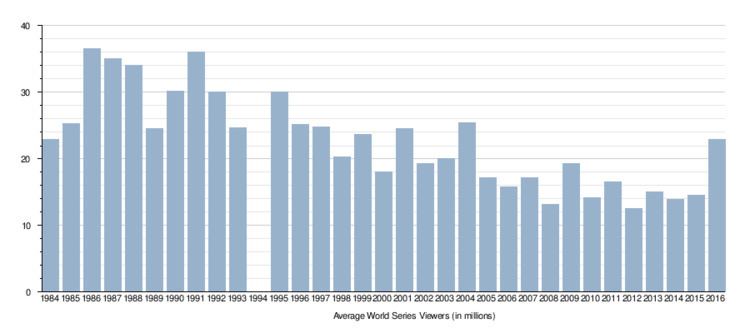
Television ratings by year, 1984 – present
Figures are expressed as ratings/share. Ratings represent the percentage of U.S. households that watched the game on television. Share represents the percentage of television sets in use that were tuned to the game.