
 | ||
Trading with the williams r oscillator
Williams %R, or just %R, is a technical analysis oscillator showing the current closing price in relation to the high and low of the past N days (for a given N). It was developed by a publisher and promoter of trading materials, Larry Williams. Its purpose is to tell whether a stock or commodity market is trading near the high or the low, or somewhere in between, of its recent trading range.
Contents
- Trading with the williams r oscillator
- Top technical indicators how to use williams r
- Buy Sell Signalling
- References
The oscillator is on a negative scale, from −100 (lowest) up to 0 (highest), obverse of the more common 0 to 100 scale found in many Technical Analysis oscillators. A value of −100 means the close today was the lowest low of the past N days, and 0 means today's close was the highest high of the past N days. (Although sometimes the %R is adjusted by adding 100.)
Top technical indicators how to use williams r
Buy-/Sell-Signalling
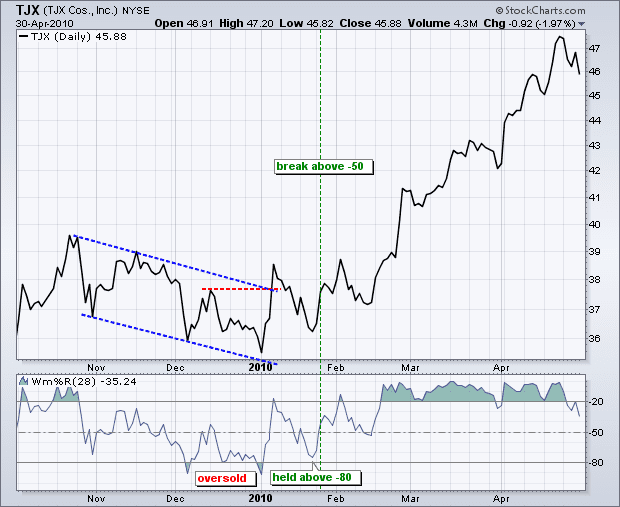
Williams used a 10 trading day period and considered values below -80 as oversold and above -20 as overbought. But they were not to be traded directly, instead his rule to buy an oversold was
or conversely to sell an overbought condition
The timeframe can be changed for either more sensitive or smoother results. The more sensitive you make it, though, the more false signals you will get.