
 | ||
Wealth inequality in the United States (also known as the wealth gap) is the unequal distribution of assets among residents of the United States. Wealth includes the values of homes, automobiles, personal valuables, businesses, savings, and investments.
Contents
- Statistics
- Early 20th Century
- Wealth and income
- Wealth inequality and child poverty
- Causes of wealth inequality
- Racial disparities
- Effect on democracy
- References
However, according to the federal reserve, "For most households, pensions and Social Security are the most important sources of income during retirement, and the promised benefit stream constitutes a sizable fraction of household wealth" and "including pensions and Social Security in net worth makes the distribution more even".
Just prior to President Obama's 2014 State of the Union Address, media reported that the top wealthiest 1% possess 40% of the nation’s wealth; the bottom 80% own 7%; similarly, but later, the media reported, the "richest 1 percent in the United States now own more additional income than the bottom 90 percent". The gap between the top 10% and the middle class is over 1,000%; that increases another 1,000% for the top 1%. The average employee "needs to work more than a month to earn what the CEO earns in one hour." Although different from income inequality, the two are related. In Inequality for All—a 2013 documentary with Robert Reich in which he argued that income inequality is the defining issue for the United States—Reich states that 95% of economic gains went to the top 1% net worth (HNWI) since 2009 when the recovery allegedly started. More recently, in 2017, an Oxfam study found that eight rich people, six of them Americans, own as much combined wealth as "half the human race".
A 2011 study found that US citizens across the political spectrum dramatically underestimate the current US wealth inequality and would prefer a far more egalitarian distribution of wealth.
Wealth is usually not used for daily expenditures or factored into household budgets, but combined with income it comprises the family's total opportunity "to secure a desired stature and standard of living, or pass their class status along to one's children". Moreover, "wealth provides for both short- and long-term financial security, bestows social prestige, and contributes to political power, and can be used to produce more wealth." Hence, wealth possesses a psychological element that awards people the feeling of agency, or the ability to act. The accumulation of wealth grants more options and eliminates restrictions about how one can live life. Dennis Gilbert asserts that the standard of living of the working and middle classes is dependent upon income and wages, while the rich tend to rely on wealth, distinguishing them from the vast majority of Americans. A September 2014 study by Harvard Business School declared that the growing disparity between the very wealthy and the lower and middle classes is no longer sustainable.
Statistics
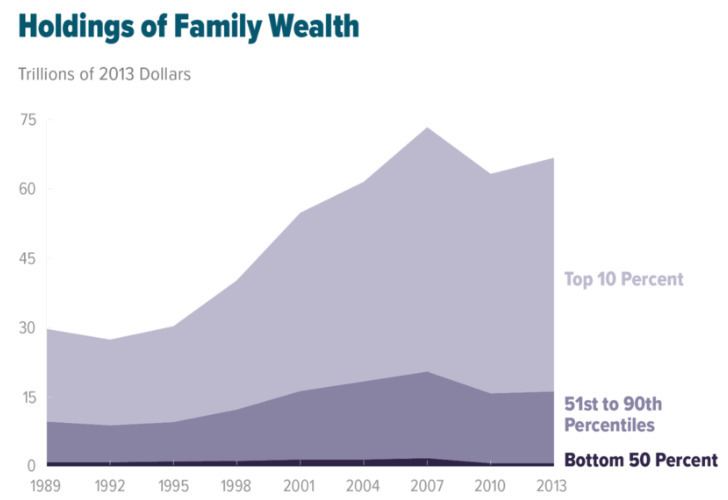
In 2007, the top 20% wealthiest possessed 80% of all financial assets. In 2007 the richest 1% of the American population owned 35% of the country's total wealth, and the next 19% owned 51%. Thus, the top 20% of Americans owned 85% of the country's wealth and the bottom 80% of the population owned 15%. In 2011, financial inequality was greater than inequality in total wealth, with the top 1% of the population owning 43%, the next 19% of Americans owning 50%, and the bottom 80% owning 7%. However, after the Great Recession which started in 2007, the share of total wealth owned by the top 1% of the population grew from 35% to 37%, and that owned by the top 20% of Americans grew from 85% to 88%. The Great Recession also caused a drop of 36% in median household wealth but a drop of only 11% for the top 1%, further widening the gap between the top 1% and the bottom 99%.
According to PolitiFact and others, in 2011 the 400 wealthiest Americans "have more wealth than half of all Americans combined." Inherited wealth may help explain why many Americans who have become rich may have had a "substantial head start". In September 2012, according to the Institute for Policy Studies, "over 60 percent" of the Forbes richest 400 Americans "grew up in substantial privilege".
In 2013 wealth inequality in the U.S. was greater than in most developed countries other than Switzerland and Denmark. In the United States, the use of offshore holdings is exceptionally small compared to Europe, where much of the wealth of the top percentiles is kept in offshore holdings. While the statistical problem is European wide, in Southern Europe statistics become even more unreliable. Less than a thousand people in Italy have declared incomes of more than 1 million euros. Former Prime Minister of Italy described tax evasion as a "national pastime". According to a 2014 Credit Suisse study, the ratio of wealth to household income is the highest it has been since the Great Depression.
Early 20th Century
Pioneering work by Simon Kuznets using income tax records and his own well-researched estimates of national income showed a reduction of about 10% in the portion of national income going to the top 10%, a reduction from about 45–50% in 1913 to about 30–35% in 1948. This period spans both The Great Depression and World War II, events with significant economic consequences. This is called the Great Compression.
Wealth and income
There is an important distinction between income and wealth. Income refers to a flow of money over time in the form of a rate (per hour, per week, or per year); wealth is a collection of assets owned. In essence, income is specifically what people receive through work, retirement, or social welfare whereas wealth is what people own. While the two are seemingly related, income inequality alone is insufficient for understanding economic inequality for two reasons:
- It does not accurately reflect an individual's economic position
- Income does not portray the severity of financial inequality in the United States.
The United States Census Bureau formally defines income as "received on a regular basis (exclusive of certain money receipts such as capital gains) before payments for personal income taxes, social security, union dues, medicare deductions, etc. By this official measure, the wealthiest families have low income but the value of their assets earns enough money to support their lifestyle. Dividends from trusts or gains in the stock market do not fall under the definition of income but are the primary money flows for the wealthy. Retired people also have little income but usually have a higher net worth because of money saved over time.
Additionally, income does not capture the extent of wealth inequality. Wealth is derived over time from the collection of income earnings and growth of assets. The income of one year cannot encompass the accumulation over a lifetime. Income statistics view too narrow a time span for it to be an adequate indicator of financial inequality. For example, the Gini coefficient for wealth inequality increased from 0.80 in 1983 to 0.84 in 1989. In the same year, 1989, the Gini coefficient for income was only 0.52. The Gini coefficient is an economic tool on a scale from 0 to 1 that measures the level of inequality. 1 signifies perfect inequality and 0 represents perfect equality. From this data, it is evident that in 1989 there was a discrepancy about the level of economic disparity with the extent of wealth inequality significantly higher than income inequality. Recent research shows that many households, in particular those headed by young parents (younger than 35), minorities, and individuals with low educational attainment, display very little accumulation. Many have no financial assets and their total net worth is also low.
According to the Congressional Budget Office, between 1979 and 2007 incomes of the top 1% of Americans grew by an average of 275%. ... (Note: The IRS insists that comparisons of adjusted gross income pre-1987 and post-1987 are complicated by large changes in the definition of AGI led to households in the top income quintile reporting a lot more of their income in their individual income tax form's AGI, rather than reporting their business income in separate corporate tax returns, or not reporting certain non-taxable income in their AGI at all, such as municipal bond income. Anyone who wants to discuss incomes in the U.S. fairly must include a chart of all available data split by quintile up to the mid-1980s. That should be followed by a chart from 1990 to 2011. The five-year gap would avoid the major AGI definition changes. The big picture of this subject is not just a segment of all available data starting in 1979, especially after the IRS warned about the large AGI definition changes in the late 1980s). In addition, IRS studies consistently show a majority of households in the top income quintile have moved to a lower quintile within one decade. There are even more changes to households in the top 1%. Without including those data here, a reader is likely to assume households in the Top 1% are almost the same from year to year.) In 2009, people in the top 1% of taxpayers made of $343,927 or more. According to US economist Joseph Stiglitz the richest 1% of Americans gained 93% of the additional income created in 2010. A study by Emmanuel Saez and Piketty showed that the top 10 percent of earners took more than half of the country’s total income in 2012, the highest level recorded since the government began collecting the relevant data a century ago. People in the top one percent were three times more likely to work more than 50 hours a week, were more likely to be self-employed, and earned a fifth of their income as capital income. The top one percent was composed of many professions and had an annual turnover rate of more than 25%. The five most common professions were managers, physicians, administrators, lawyers, and teachers.
In the book, Modern Labor Economics: Theory and Public Policy it is noted that in the United States all income that employees received from their employers in 2012 was 8.6 trillion dollars while the amount of money received from all other sources of personal income in that year came to 5.3 trillion dollars. This makes the relationship of employee to employer and vocational employment in general of paramount importance in the United States.
Wealth inequality and child poverty
In 2013 UNICEF data on the well-being of children in 35 developed nations ranked the United States at 34 out of 35 (Romania is the worst). This may reflect growing income inequality.
Causes of wealth inequality
Essentially, the wealthy possess greater financial opportunities that allow their money to make more money. Earnings from the stock market or mutual funds are reinvested to produce a larger return. Over time, the sum that is invested becomes progressively more substantial. Those who are not wealthy, however, do not have the resources to enhance their opportunities and improve their economic position. Rather, "after debt payments, poor families are constrained to spend the remaining income on items that will not produce wealth and will depreciate over time." Scholar David B. Grusky notes that "62 percent of households headed by single parents are without savings or other financial assets". Net indebtedness generally prevents the poor from having any opportunity to accumulate wealth and thereby better their conditions.
Notably, for both the wealthy and not-wealthy, the process of accumulation or debt is cyclical. The rich use their money to earn larger returns and the poor have no savings with which to produce returns or eliminate debt. Unlike income, both facets are generational. Wealthy families pass down their assets allowing future generations to develop even more wealth. The poor, on the other hand, "are less able to leave inheritances to their children leaving the latter with little or no wealth on which to build…This is another reason why wealth inequality is so important- its accumulation has direct implications for economic inequality among the children of today's families."
Corresponding to financial resources, the wealthy strategically organize their money so that it will produce profit. Affluent people are more likely to allocate their money to financial assets such as stocks, bonds, and other investments which hold the possibility of capital appreciation. Those who are not wealthy are more likely to have their money in savings accounts and home ownership. This difference comprises the largest reason for the continuation of wealth inequality in America: the rich are accumulating more assets while the middle and working classes are just getting by. Currently, the richest 1% hold about 38% of all privately held wealth in the United States. while the bottom 90% held 73% of all debt. According to The New York Times, the "richest 1 percent in the United States now own more wealth than the bottom 90 percent".
However, other studies argue that higher average savings rate will contribute to the reduction of the share of wealth owned by the rich. The reason is that the rich in wealth are not necessarily the individuals with the highest income. Therefore, the relative wealth share of poorer quintiles of the population would increase if the savings rate of income is very large, although the absolute difference from the wealthiest will increase.
As the price of commodities increases because of inflation, a larger percentage of lower-class people's money is spent on things they need to survive and go to work, such as food and gasoline. Most of the working poor are paid fixed hourly wages that do not keep up with rises in prices, so every year an increasing percentage of their income is consumed until they have to go into debt just to survive. At this point, their little wealth is owed to lenders and banking institutions.
The nature of tax policies in America has been suggested by economists and politicians such as Emmanuel Saez, Thomas Piketty, and Barack Obama to perpetuate economic inequality in America by steering large sums of wealth into the hands of the wealthiest Americans. The mechanism for this is that when the wealthy avoid paying taxes, wealth concentrates to their coffers and the poor go into dept. This claim has created much controversy and debate within the academic and political spheres.
The economist Joseph Stiglitz argues that "Strong unions have helped to reduce inequality, whereas weaker unions have made it easier for CEOs, sometimes working with market forces that they have helped shape, to increase it." The long fall in unionization in the U.S. since WWII has seen a corresponding rise in the inequality of wealth and income.
Racial disparities
The wealth gap between white and black families nearly tripled from $85,000 in 1984 to $236,500 in 2009.
There are many causes, including years of home ownership, household income, unemployment, and education but inheritance might be the most important. Inheritance can directly link the disadvantaged economic position and prospects of today's blacks to the disadvantaged positions of their parents' and grandparents' generations. According to a report done by Robert B. Avery and Michael S. Rendall, one in three white households will receive a substantial inheritance during their lifetime compared to only one in ten black households. This relative lack of inheritance that has been observed among African Americans can be attributed in large part to factors such as- unpaid labor (slavery), violent destruction of personal property in incidents such as Red Summer of 1919, unequal opportunity in education and employment (racial discrimination), and more recent policies such as redlining and planned shrinkage. Other ethnic minorities, particularly those with darker complexions, have at times faced many of these same adversities to various degrees.
The article "America's Financial Divide" added context to racial wealth inequality stating "...nearly 96.1 percent of the 1.2 million households in the top one percent by income were white, a total of about 1,150,000 households. In addition, these families were found to have a median net asset worth of $8.3 million dollars. In stark contrast, in the same piece black households were shown as a mere 1.4 percent of the top one percent by income, that's only 16,800 homes. In addition, their median net asset worth was just $1.2 million dollars. Using this data as an indicator only several thousand of the over 14 million African American households have more than $1.2 million dollars in net assets... Relying on data from Credit Suisse and Brandeis University's Institute on Assets and Social Policy, the Harvard Business Review in the article "How America's Wealthiest Black Families Invest Money" recently took the analysis above a step further. In the piece the author stated "If you're white and have a net worth of about $356,000 dollars, that's good enough to put you in the 72nd percentile of white families. If you're black, it's good enough to catapult you into the 95th percentile." This means 28 percent of the total 83 million white homes, or over 23 million white households, have more than $356,000 dollars in net assets. While only 700,000 of the 14 million black homes have more than $356,000 dollars in total net worth." According to Inequality.org "the median black family is actually only worth $1,700 when you deduct these durables. In contrast, the median white family holds $116,800 of wealth using the same accounting methods. Some historical context: In South Africa, during the atrocities of apartheid, the median black family held about 7 percent of typical white South African family net worth. Today, using Wolff’s analysis, the median African American family holds a mere 1.5 percent of median white American family wealth.
A recent piece on Eurweb/Electronic Urban Report "Black Wealth Hardly Exists, Even When You Include NBA, NFL and Rap Stars" stated this about the difference between black middle class families, and white middle class families. "Going even further into the data, a recent study by the Institute for Policy Studies (IPS) and the Corporation For Economic Development (CFED) found that it would take 228 years for the average black family to amass the same level of wealth the average white family holds today in 2016. All while white families create even more wealth over those same two hundred years. In fact, this is a gap that will never close if America stays on its current economic path. According to the Institute on Assets and Social Policy, for each dollar of increase in average income an African American household saw from 1984 – 2009 just $0.69 in additional wealth was generated, compared with the same dollar in increased income creating an additional $5.19 in wealth for a similarly situated white household."
Author Lilian Singh wrote on why the perceptions about black life created by media are misleading in the American Prospect piece "Black Wealth On TV: Realities Don’t Match Perceptions". "Black programming features TV shows that collectively create false perceptions of wealth for African-American families. The images displayed are in stark contrast to the economic conditions the average black family is battling each day."
In an article on Huffington Post by Antonio Moore "The Decadent Veil: Black America's Wealth Illusion" the question of inequity is taken another critical step forward and the piece digs into how celebrity is masking this massive inequality. Excerpt: "The decadent veil looks at black Americans through a lens of group theory and seeks to explain an illusion that has taken form over a 30-year span of financial deregulation and new found access to unsecured credit. This veil is trimmed with million-dollar sports contracts, Roc Nation tour deals and designer labels made for heads of state. As black celebrity invited us into their homes through shows like MTV cribs, we forgot the condition of overall African American financial affairs. Despite a large section of the 14 million black households drowning in poverty and debt the stories of a few are told as if they represent those of millions, not thousands. It is this new veil of economics that has allowed for a broad swath of America to become not just desensitized to black poverty, but also hypnotized by black celebrity... The decadent veil not only warps the black community's vision outward to a larger economic world, but it also distorts outside community's view of Black America's actual financial reality."
Effect on democracy
A 2014 study by researchers at Princeton and Northwestern concludes that government policies reflect the desires of the wealthy, and that the vast majority of American citizens have "minuscule, near-zero, statistically non-significant impact upon public policy . . . when a majority of citizens disagrees with economic elites and/or with organized interests, they generally lose." When Fed chair Janet Yellen was questioned by Bernie Sanders about the study at a congressional hearing in May 2014, she responded “There’s no question that we’ve had a trend toward growing inequality” and that this trend “can shape [and] determine the ability of different groups to participate equally in a democracy and have grave effects on social stability over time.”
In Capital in the Twenty-First Century, French economist Thomas Piketty argues that "extremely high levels" of wealth inequality are "incompatible with the meritocratic values and principles of social justice fundamental to modern democratic societies" and that "the risk of a drift towards oligarchy is real and gives little reason for optimism about where the United States is headed."