
 | ||
A vector signal analyzer is an instrument that measures the magnitude and phase of the input signal at a single frequency within the IF bandwidth of the instrument. The primary use is to make in-channel measurements, such as error vector magnitude, code domain power, and spectral flatness, on known signals.
Contents
Vector signal analyzers are useful in measuring and demodulating digitally modulated signals like W-CDMA, LTE, and WLAN. These measurements are used to determine the quality of modulation and can be used for design validation and compliance testing of electronic devices.
Operation
The vector signal analyzer spectrum analysis process typically has a down-convert & digitizing stage and a DSP & display stage.
Down Convert & Digitize Stage
A vector signal analyzer operates by first down converting the signal spectra by using superheterodyne techniques. A portion of the input signal spectrum is down-converted (using a voltage-controlled oscillator and a mixer) to the center frequency of a band-pass filter. The use of a voltage-controlled oscillator allows for consideration of different carrier frequencies.
After the conversion to an intermediate frequency, the signal is filtered in order to band-limit the signal and prevent aliasing. The signal is then digitized using an analog-to-digital converter. Sampling rate is often varied in relation to the frequency span under consideration.
DSP & Display stage
Once the signal is digitized, it is separated into quadrature and in-phase components using a quadrature detector, which is typically implemented with a discrete Hilbert transform. Several measurements are made and displayed using these signal components and various DSP processes, such as the ones below
Signal Spectrum from FFT
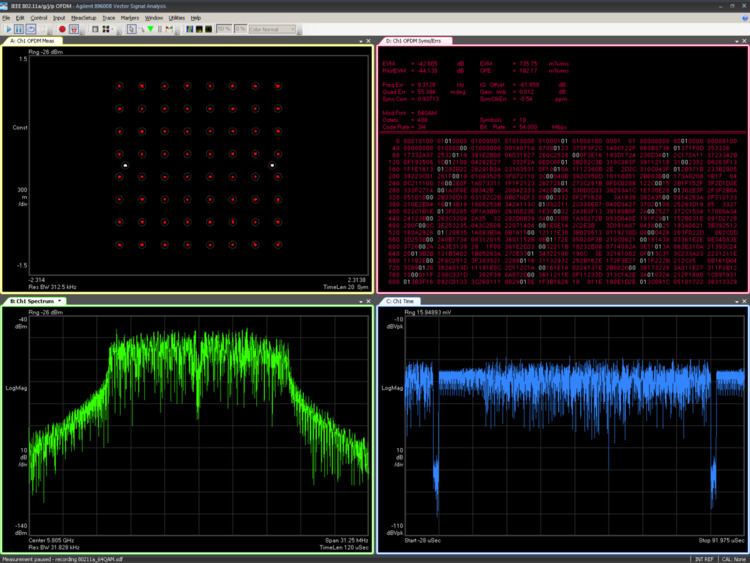
A FFT is used to compute the frequency spectrum of the signal. Usually there is a windowing function option to limit spectral leakage and enhance frequency resolution. This window is implemented by multiplying it with the digitized values of the sample period before computing the FFT.Constellation Diagram
A constellation diagram represents a signal modulated by a digital modulation scheme such as quadrature amplitude modulation or phase-shift keying. This diagram maps the magnitude of the quadrature and in-phase components to the vertical and horizontal directions, respectively. Qualitative assessments of signal integrity can be made based on interpretation of this diagram.Error Vector Magnitude
By representing the quadrature and in-phase components as the vertical and horizontal axes, the error vector magnitude can be computed as the distance between the ideal and measured constellation points on the diagram. This requires knowledge of the modulated signal in order to compare the received signal with the ideal signal.Typical Functionality
Typical vector signal analyzer displays feature the spectrum of the signal measured within the IF bandwidth, a constellation diagram of the demodulated signal, error vector magnitude measurements, and a time domain plot of the signal. Many more measurement results can be displayed depending on the type of modulation being used (symbol decoding, MIMO measurements, radio frame summary, etc.).