
 | ||
VIX is the ticker symbol for the CBOE Volatility Index, a popular measure of the implied volatility of S&P 500 index options, calculated and published by the Chicago Board Options Exchange (CBOE). It is colloquially referred to as the fear index or the fear gauge.
Contents
The VIX concept formulates a theoretical expectation of stock market volatility in the near future. The current VIX index value quotes the expected annualized change in the S&P 500 index over the next 30 days, as computed from the options-based theory and current options-market data.
The formulation of a volatility index, and financial instruments based on such an index, were developed by Menachem Brenner and Dan Galai in 1986 and described in two academic papers. The authors stated the "volatility index, to be named Sigma Index, would be updated frequently and used as the underlying asset for futures and options. ... A volatility index would play the same role as the market index play for options and futures on the index."
The CBOE retained Robert Whaley in 1992 to develop a tradable stock market volatility index based on index option prices. Since 1993, CBOE has published VIX real-time data. Based on the history of index option prices, Whaley computed retrospective daily VIX levels commencing January 1986.
Specifications
The VIX is calculated and disseminated in real-time by the Chicago Board Options Exchange. Theoretically it is a weighted blend of prices for a range of options on the S&P 500 index. On March 26, 2004, the first-ever trading in futures on the VIX began on CBOE Futures Exchange (CFE). As of February 24, 2006, it became possible to trade VIX options contracts. Several exchange-traded funds seek to track its performance. The formula uses a kernel-smoothed estimator that takes as inputs the current market prices for all out-of-the-money calls and puts for the front month and second month expirations. The goal is to estimate the implied volatility of the S&P 500 index over the next 30 days.
The VIX is calculated as the square root of the par variance swap rate for a 30-day term initiated today. Note that the VIX is the volatility of a variance swap and not that of a volatility swap (volatility being the square root of variance, or standard deviation). A variance swap can be perfectly statically replicated through vanilla puts and calls whereas a volatility swap requires dynamic hedging. The VIX is the square root of the risk-neutral expectation of the S&P 500 variance over the next 30 calendar days. The VIX is quoted as an annualized standard deviation.
The VIX has replaced the older VXO as the preferred volatility index used by the media. VXO was a measure of implied volatility calculated using 30-day S&P 100 index at-the-money options.
Statistician Salil Mehta of Statistical Ideas shows the distribution of the VIX.
Interpretation
The VIX is quoted in percentage points and represents the expected range of movement in the S&P 500 index over the next year, at a 68% confidence level (i.e. one standard deviation of the normal probability curve). For example, if the VIX is 15, this represents an expected annualized change, with a 68% probability, of less than 15% up or down. One can calculate the expected volatility range for a single month from this figure by dividing the VIX figure of 15 not by 12, but by √12 which would imply a range of +/- 4.33% over the next 30-day period. Similarly, expected volatility for a week would be 15 divided by √52, or +/- 2.08%.
The price of call and put options can be used to calculate implied volatility, because volatility is one of the factors used to calculate the value of these options. Higher (or lower) volatility of the underlying security makes an option more (or less) valuable, because there is a greater (or smaller) probability that the option will expire in the money (i.e., with a market value above zero). Thus, a higher option price implies greater volatility, other things being equal.
Even though the VIX is quoted as a percentage rather than a dollar amount, there are a number of VIX-based derivative instruments in existence, including:
Similar indices for bonds include the MOVE, LBPX indices.
Although the VIX is often called the "fear index", a high VIX is not necessarily bearish for stocks. Instead, the VIX is a measure of market perceived volatility in either direction, including to the upside. In practical terms, when investors anticipate large upside volatility, they are unwilling to sell upside call stock options unless they receive a large premium. Option buyers will be willing to pay such high premiums only if similarly anticipating a large upside move. The resulting aggregate of increases in upside stock option call prices raises the VIX just as does the aggregate growth in downside stock put option premiums that occurs when option buyers and sellers anticipate a likely sharp move to the downside. When the market is believed as likely to soar as to plummet, writing any option that will cost the writer in the event of a sudden large move in either direction may look equally risky.
Hence high VIX readings mean investors see significant risk that the market will move sharply, whether downward or upward. The highest VIX readings occur when investors anticipate that huge moves in either direction are likely. Only when investors perceive neither significant downside risk nor significant upside potential will the VIX be low.
The Black–Scholes formula uses a model of stock price dynamics to estimate how an option’s value depends on the volatility of the underlying assets.
Limitation and GVIX
Chow, Jiang and Li (2014) demonstrated that without imposing any structure on the underlying forcing process, the model-free CBOE volatility index (VIX) does not measure market expectation of volatility but that of a linear moment-combination. Particularly, VIX undervalues (overvalues) volatility when market return is expected to be negatively (positively) skewed. Alternatively, they develop a model-free generalized volatility index (GVIX). With no diffusion assumption, GVIX is formulated directly from the definition of log-return variance, and VIX is a special case of the GVIX. Empirically, VIX generally understates the true volatility, and the estimation errors considerably enlarge during volatile markets. In addition, the spread between GVIX and VIX (GV-Spread) follows a mean-reverting process.
Criticisms
VIX is sometimes criticized in terms of it being a prediction of future volatility. It is a measure of the current price of index options.
Despite their sophisticated composition, critics claim the predictive power of most volatility forecasting models is similar to that of plain-vanilla measures, such as simple past volatility. However, other works have countered that these critiques failed to correctly implement the more complicated models.
Some practitioners and portfolio managers seem to completely ignore or dismiss volatility forecasting models. For example, Nassim Taleb famously titled one of his Journal of Portfolio Management papers We Don't Quite Know What We are Talking About When We Talk About Volatility.
In a similar note, Emanuel Derman expressed his disillusion with the enormous supply of empirical models unsupported by theory. He argues that, while "theories are attempts to uncover the hidden principles underpinning the world around us, as Albert Einstein did with his theory of relativity", we should remember that "models are metaphors -- analogies that describe one thing relative to another".
Michael Harris has argued that VIX just tracks the inverse of price and it has no predictive power as a result.
VIX should have predictive power as long as the prices computed by the Black-Scholes equation are valid assumptions about the volatility predicted for the future lead time (the remaining time to maturity). Robert J. Shiller argues that it would be circular reasoning to consider VIX to be proof of Black-Scholes, because they both express the same implied volatility. He also finds that calculating VIX retrospectively in 1929 does not predict the highest-ever volatility of the Great Depression, due to the anomolous conditions of the Great Depression itself, and we thus have no confidence in VIX to predict, even weakly, such severe events if they should occur in the future.
History
Here is a timeline of some key events in the history of the VIX Index:
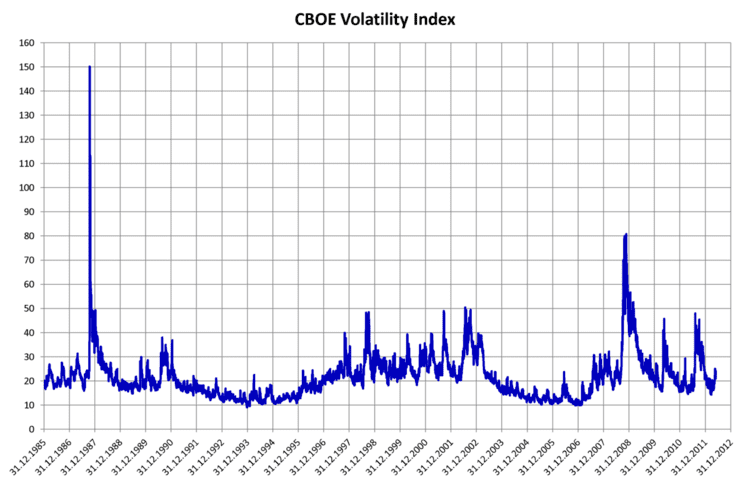
Between 1990 and October 2008, the average value of VIX was 19.04.
In 2004 and 2006, VIX Futures and VIX Options, respectively, were named Most Innovative Index Product at the Super Bowl of Indexing Conference.