
 | ||
These are tables of congressional delegations from Pennsylvania to the United States House of Representatives and the United States Senate.
Contents
- Current Representatives
- Delegation timeline 1789 present
- 17891793 8 Seats
- 17931803 13 Seats
- 18031813 18 seats
- 18131823 23 Seats
- 18331843 28 seats
- 18831893 28 seats
- 18931903 30 seats
- 19031913 32 seats
- 19131933 36 seats
- 19331943 34 seats
- 19431953 33 seats
- 19531963 30 seats
- 19631973 27 seats
- 19731983 25 seats
- 19831993 23 seats
- 19932003 21 seats
- 20032013 19 seats
- 20132023 18 seats
- Senate delegation timeline 1789 present
- Living former US Senators from Pennsylvania
- References
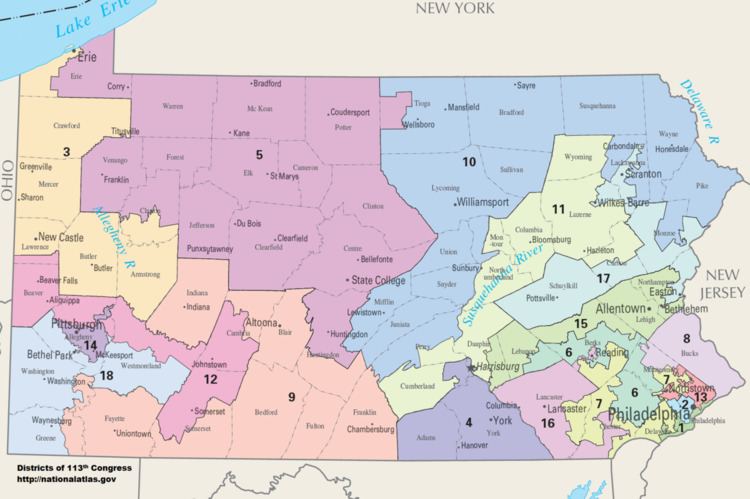
Current Representatives
List of members of the Pennsylvanian United States House delegation, their terms in office, district boundaries, and the district political ratings according to the CPVI. The delegation has a total of 18 members, with 13 Republicans, and 5 Democrats.
Delegation timeline (1789 – present)
Tables showing membership in the Pennsylvania federal House delegation throughout history of statehood in the United States.
1789–1793: 8 Seats
For the first two Congresses, Pennsylvania had eight seats. In the First Congress, Representatives were selected At-large on a general ticket. Districts were used in the Second Congress.
1793–1803: 13 Seats
Pennsylvania had thirteen seats. For the third Congress Representatives were selected At-large on a general ticket. After that, districts were created.
1803–1813: 18 seats
There were eighteen seats, apportioned among eleven districts. Districts 1–3 each had three seats elected on a general ticket. District 4 had two such seats. Districts 5–11 each had one seat.
1813–1823: 23 Seats
There were 15 districts. The 1st district had four seats elected on a general ticket. The 2nd, 3rd, 5th, 6th and 10th each had two seats elected on a general ticket. The rest of the districts each had one seat.
1833–1843: 28 seats
Following the 1830 census, Pennsylvania was apportioned 28 seats. The commonwealth divided them into 25 districts and two districts, the 2nd and the 4th, had two and three seats respectively.
1883–1893: 28 seats
Following the 1880 Census, the delegation grew by one seat. Until 1889, that seat was elected at-large statewide. After 1889, the state was redistricted into 28 districts.
1893–1903: 30 seats
Following the 1890 Census, the delegation grew by two seats. Those two additional seats were elected at-large across the entire commonwealth.
1903–1913: 32 seats
Following the 1900 Census, the delegation grew by two seats.
1913–1933: 36 seats
Following the 1910 Census, the delegation grew by four seats to its largest size to date. The four new seats were elected at-large statewide. Starting in 1923, however, four new districts were added to replace the at-large seats.
1933–1943: 34 seats
Following the 1930 Census, the delegation lost two seats.
1943–1953: 33 seats
Following the 1940 Census, the delegation lost one seat. For the 78th Congress, there were 32 districts and 1 at-large seat. Starting with the 79th Congress, however, there were 33 districts.
1953–1963: 30 seats
Following the 1950 Census, the delegation lost three seats.
1963–1973: 27 seats
Following the 1960 Census, the delegation lost three seats.
1973–1983: 25 seats
Following the 1970 Census, the delegation lost two seats.
1983–1993: 23 seats
Following the 1980 Census, the delegation lost two seats.
1993–2003: 21 seats
Following the 1990 Census, the delegation lost two seats.
2003–2013: 19 seats
Following the 2000 Census, the delegation lost two seats.
2013–2023: 18 seats
Following the 2010 Census, the delegation lost one seat.
Key
Senate delegation timeline (1789 – present)
Tables showing membership in the Pennsylvania federal Senate delegation throughout history of statehood in the United States.
Living former U.S. Senators from Pennsylvania
As of August 2015, there are two former U.S. Senators from the U.S. State of Pennsylvania who are currently living at this time, one from Class 1 and one from Class 3.