
 | ||
Unemployment in the United States discusses the causes and measures of U.S. unemployment and strategies for reducing it. Job creation and unemployment are affected by factors such as economic conditions, global competition, education, automation, and demographics. These factors can affect the number of workers, the duration of unemployment, and wage levels.
Contents
- Map of United States
- Overview
- Definitions of unemployment
- Employed
- Unemployed
- Labor force
- US employment history
- Jobs created by Presidential term
- Recent employment trends
- Unemployment rates
- Level of employment and job creation
- Labor force participation
- Mix of full time and part time jobs
- Other measures
- Pace of recovery
- Demographics and employment trends
- Age
- Gender
- Education
- Race
- Native or foreign born
- Causes of unemployment
- Fiscal and monetary policy
- Fiscal policy
- Monetary policy
- Liberal position
- Conservative position
- Poll data
- 20082009 debates
- Creating American Jobs and Ending Offshoring Act
- American Jobs Act
- Fiscal cliff
- Individual income taxes
- Corporate income taxes
- Solutions for creating more US jobs
- Infrastructure investment
- Tax policy
- Lower healthcare costs
- Energy policy and carbon price certainty
- Employment policies and the minimum wage
- Regulatory reform
- Education policy
- Income inequality
- Trade policy
- Long term unemployment
- Presidents Council on Jobs and Competitiveness
- Analytical perspectives
- Labor market recovery following 20072009 recession
- Comparison of employment recovery across recessions and financial crises
- Share of full time and part time workers
- Estimates
- Empirical data
- International labor force size comparisons
- Effect of disability recipients on labor force participation measures
- Effects on health and mortality
- Effects of healthcare reform
- Job growth projections 20142024
- Monthly jobs reports
- Federal Reserve Database FRED
- Unemployment rate forecasts
- Off shoring statistics
- References
Map of United States
Overview
Unemployment generally falls during periods of economic prosperity and rises during recessions, creating significant pressure on public finances as tax revenue falls and social safety net costs increase. For example, employment expanded consistently during the 1990s, but has been inconsistent since due to recessions in 2001 and 2007–2009. As of May 2016, the employment recovery relative to the December 2007 (pre-recession) level was mixed. Variables such as the unemployment rate (U-3) and number of employed have improved beyond their pre-recession levels. However, the wider U-6 unemployment rate, measures of labor force participation (even among the prime working age group), and the share of long-term unemployed were worse than pre-crisis levels. Further, the mix of jobs has shifted, with a larger share of part-time workers than pre-crisis.
Government spending and taxation decisions (fiscal policy) and U.S. Federal Reserve interest rate adjustments (monetary policy) are important tools for managing the unemployment rate. There may be an economic trade-off between unemployment and inflation, as policies designed to reduce unemployment can create inflationary pressure, and vice versa. The U.S. Federal Reserve (the Fed) has a dual mandate to achieve full employment while maintaining a low rate of inflation. Debates regarding monetary policy during 2014–2015 centered on the timing and extent of interest rate increases, as a near-zero interest rate target had remained in place since the 2007–2009 recession. Ultimately, the Fed decided to raise interest rates marginally in December 2015.
The major political parties debate appropriate solutions for improving the job creation rate, with liberals arguing for more government spending and conservatives arguing for lower taxes and less regulation. Polls indicate that Americans believe job creation is the most important government priority, with not sending jobs overseas the primary solution. Much of the 2012 Presidential campaign focused on job creation as a first priority, but the fiscal cliff and other fiscal debates took precedence in 2012 and early 2013. Critics argued prioritizing deficit reduction was misplaced, as there was no immediate fiscal crisis but there was a high level of unemployment, particularly long-term unemployment.
Unemployment can be measured in several ways. A person is unemployed if they are jobless but looking for a job and available for work. People who are neither employed nor unemployed are not in the labor force. For example, as of December 2015, the unemployment rate in the United States was 5.0% or 7.9 million people, while the government's broader U-6 unemployment rate, which includes the part-time underemployed was 9.9% or approximately 16.4 million people. These figures were calculated with a civilian labor force of approximately 157.8 million people, relative to a U.S. population of approximately 323 million people. The U.S. Bureau of Labor Statistics (BLS) publishes a monthly "Employment Situation Summary" with key statistics and commentary.
In 2014, Williams County, North Dakota had the lowest percentage of unemployed people of any county or census area in the United States, at 1.2 percent, while Wade Hampton Census Area, Alaska had the highest, at 23.7 percent.
Definitions of unemployment
The U.S. Bureau of Labor Statistics has defined the basic employment concepts as follows:
Employed
Employed persons consist of:
Unemployed
Who is counted as unemployed?
Labor force
Who is not in the labor force?
U.S. employment history
During the 1940s, the U.S Department of Labor, specifically the Bureau of Labor Statistics (BLS), began collecting employment information via monthly household surveys. Other data series are available back to 1912. The unemployment rate has varied from as low as 1% during World War I to as high as 25% during the Great Depression. More recently, it reached peaks of 10.8% in November 1982 and 10.0% in October 2009. Unemployment tends to rise during recessions and fall during expansions. From 1948 to 2015, unemployment averaged about 5.8%. There is always some unemployment, with persons changing jobs and new entrants to the labor force searching for jobs. This is referred to as frictional unemployment. For this reason, the Federal Reserve targets the natural rate of unemployment or NAIRU, which was around 5% in 2015. A rate of unemployment below this level would be consistent with rising inflation in theory, as a shortage of workers would bid wages (and thus prices) upward.
Jobs created by Presidential term
Various sources summarize the number of jobs created by Presidential term. The figures may include private or public job creation or combination. The Federal Reserve Economic Data (FRED) database contains the total nonfarm employment level, a measure of private sector job creation. For President Obama, between February 2009 and December 2015, the private sector added a total of 10 million jobs. The Calculated Risk blog also reported the number of private sector jobs created by Presidential term. Over 10 million jobs were created in each of President Clinton's two terms during the 1990s, by far the largest number among recent Presidents. President Reagan averaged over 7 million in each term during the 1980s, while George W. Bush had negative job creation in the 2000s. Each of these Presidents added net public sector (i.e., government) jobs, except President Obama.
Recent employment trends
There are a variety of measures used to track the state of the U.S. labor market. Each provides insight into the factors affecting employment. The Bureau of Labor Statistics provides a "chartbook" displaying the major employment-related variables in the economy. Members of the Federal Reserve also give speeches and Congressional testimony that explain their views of the economy, including the labor market.
As of May 2016, the employment recovery relative to the December 2007 (pre-recession) level was mixed. Variables such as the unemployment rate (U-3) and number of employed have improved beyond their pre-recession levels. However, the wider U-6 unemployment rate, measures of labor force participation (even among the prime working age group), and the share of long-term unemployed were worse than pre-crisis levels. Further, the mix of jobs has shifted, with a larger share of part-time workers than pre-crisis. For example:
Unemployment rates
Level of employment and job creation
Labor force participation
Mix of full-time and part-time jobs
Other measures
The U.S. Federal Reserve tracks a variety of labor market metrics, which affect how it sets monetary policy. One "dashboard" includes nine measures, only three of which had returned to their pre-crisis (2007) levels as of June 2014. The Fed also publishes a "Labor market conditions index" that includes a score based on 19 other employment statistics.
Pace of recovery
Research indicates recovery from financial crises can be protracted relative to typical recessions, with lengthy periods of high unemployment and substandard economic growth. Compared against combined financial crises and recessions in other countries, the U.S. employment recovery following the 2007–2009 recession was relatively fast.
Demographics and employment trends
Employment trends can be analyzed by any number of demographic factors individually or in combination, such as age, gender, educational attainment, and race. A major trend underlying the analysis of employment numbers is the aging of the white workforce, which is roughly 70% of the employment total by race as of November 2016. For example, the prime working age (25–54) white population declined by 4.8 million between December 2007 and November 2016, roughly 5%, while non-white populations are increasing. This is a major reason why non-white and foreign-born workers are increasing their share of the employed. However, white prime-age workers have also had larger declines in labor force participation than some non-white groups, for reasons not entirely clear. Such changes may have important political implications.
Age
Gender
Education
Race
Native- or foreign-born
BLS statistics indicate foreign-born workers have filled jobs dis-proportionally to their share in the population.
Causes of unemployment
There are a variety of domestic, foreign, market and government factors that impact unemployment in the United States. These may be characterized as cyclical (related to the business cycle) or structural (related to underlying economic characteristics) and include, among others:
Fiscal and monetary policy
Employment is both cause and response to the economic growth rate, which can be affected by both government fiscal policy (spending and tax decisions) and monetary policy (Federal Reserve action.)
Fiscal policy
The U.S. ran historically large annual debt increases from 2008 to 2013, adding over $1 trillion in total national debt annually from fiscal year 2008 to 2012. The deficit expanded primarily due to a severe financial crisis and recession. With a U.S. GDP of approximately $17 trillion, the spending implied by this deficit comprises a significant amount of GDP. Keynesian economics argues that when the economic growth is slow, larger budget deficits are stimulative to the economy. This is one reason why the significant deficit reduction represented by the fiscal cliff was expected to result in a recession.
However, the deficit from 2014 to 2016 was in line with historical average, meaning it was not particularly stimulative. For example, CBO reported in October 2014: "The federal government ran a budget deficit of $486 billion in fiscal year 2014...$195 billion less than the shortfall recorded in fiscal year 2013, and the smallest deficit recorded since 2008. Relative to the size of the economy, that deficit—at an estimated 2.8 percent of gross domestic product (GDP)—was slightly below the average experienced over the past 40 years, and 2014 was the fifth consecutive year in which the deficit declined as a percentage of GDP since peaking at 9.8 percent in 2009. By CBO's estimate, revenues were about 9 percent higher and outlays were about 1 percent higher in 2014 than they were in the previous fiscal year."
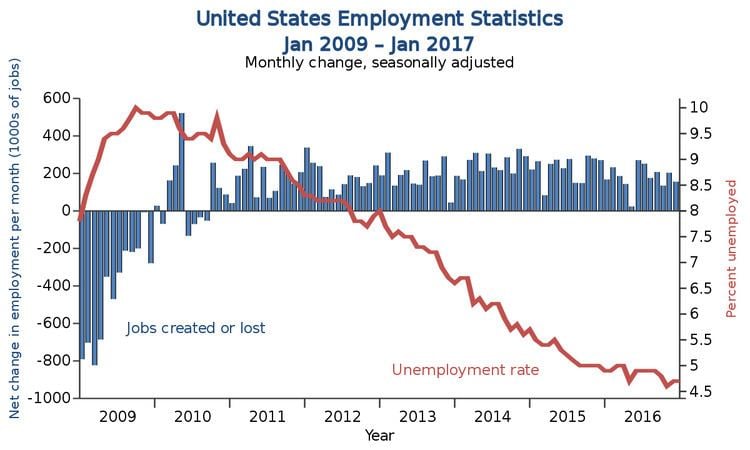
As part of the economic policy of Barack Obama, the United States Congress funded approximately $800 billion in spending and tax cuts via the February 2009 American Recovery and Reinvestment Act to stimulate the economy. Monthly job losses began slowing shortly thereafter. By March 2010, employment again began to rise. From March 2010 to September 2012, over 4.3 million jobs were added, with consecutive months of employment increases from October 2010 to December 2015. As of December 2015, employment of 143.2 million was 4.9 million above the pre-crisis peak in January 2008 of 138.3 million.
Monetary policy
The U.S. Federal Reserve (the Fed) has a dual mandate to achieve full employment while maintaining a low rate of inflation. U.S. Federal Reserve interest rate adjustments (monetary policy) are important tools for managing the unemployment rate. There may be an economic trade-off between unemployment and inflation, as policies designed to reduce unemployment can create inflationary pressure, and vice versa. Debates regarding monetary policy during 2014–2015 centered on the timing and extent of interest rate increases, as a near-zero interest rate target had remained in place since the 2007–2009 recession. Ultimately, the Fed decided to raise interest rates marginally in December 2015. The Fed describes the type of labor market analyses it performs in making interest rate decisions in the minutes of the Federal Open Market Committee, its policy governing body, among other channels.
The U.S. Federal Reserve has taken significant action to stimulate the economy after the 2007–2009 recession. The Fed expanded its balance sheet significantly from 2008 to 2014, meaning it essentially "printed money" to purchase large quantities of mortgage-backed securities and U.S. treasury bonds. This bids up bond prices, helping keep interest rates low, to encourage companies to borrow and invest and people to buy homes. It planned to end its quantitative easing in October 2014 but was undecided on when it might raise interest rates from near record lows. The Fed also tied its actions to its outlook for unemployment and inflation for the first time in December 2012.
Liberal position
Liberals typically argue for government action or partnership with the private sector to improve job creation. Typical proposals involve stimulus spending on infrastructure construction, clean energy investment, unemployment compensation, educational loan assistance, and retraining programs. Liberals historically supported labor unions and protectionist trade policies. Liberals tend to be less concerned with budget deficits and debt and have a higher tolerance for inflation or currency devaluation to improve trade competitiveness, as a weaker currency makes exports relatively less expensive. During recessions, liberals generally advocate solutions based on Keynesian economics, which argues for additional government spending when the private sector is unable or unwilling to support sufficient levels of economic growth.
Conservative position
Conservatives typically argue for free market solutions, with less government restriction of the private sector. Conservatives tend to oppose stimulus spending or bailouts, letting the free market determine success and failure. Typical proposals involve deregulation and income tax rate reduction. Conservatives historically have opposed labor unions and encouraged free trade agreements. Fiscal conservatives express concern that higher budget deficits and debt damage confidence, reducing investment and spending. Conservatives argue for policies that reduce or lower inflation. Conservatives generally advocate supply-side economics.
Poll data
The affluent are much less inclined than other groups of Americans to support an active role for government in addressing high unemployment. Only 19% of the wealthy say that Washington should insure that everyone who wants to work can find a job, but 68% of the general public support that proposition. Similarly, only 8% of the rich say that the federal government should provide jobs for everyone able and willing to work who cannot find a job in private employment, but 53% of the general public thinks it should. A September 2012 survey by The Economist found those earning over $100,000 annually were twice as likely to name the budget deficit as the most important issue in deciding how they would vote than middle- or lower-income respondents. Among the general public, about 40% say unemployment is the most important issue while 25% say that the budget deficit is.
A March 2011 Gallup poll reported: "One in four Americans say the best way to create more jobs in the U.S. is to keep manufacturing in this country and stop sending work overseas. Americans also suggest creating jobs by increasing infrastructure work, lowering taxes, helping small businesses, and reducing government regulation." Further, Gallup reported that: "Americans consistently say that jobs and the economy are the most important problems facing the country, with 26% citing jobs specifically as the nation's most important problem in March." Republicans and Democrats agreed that bringing the jobs home was the number one solution approach, but differed on other poll questions. Republicans next highest ranked items were lowering taxes and reducing regulation, while Democrats preferred infrastructure stimulus and more help for small businesses.
Further, U.S. sentiment on free trade has been turning more negative. An October 2010 Wall Street Journal/NBC News poll reported that: "[M]ore than half of those surveyed, 53%, said free-trade agreements have hurt the U.S. That is up from 46% three years ago and 32% in 1999." Among those earning $75,000 or more, 50% now say free-trade pacts have hurt the U.S., up from 24% who said the same in 1999. Across party lines, income, and job type, 76–95% of Americans surveyed agreed that "outsourcing of production and manufacturing work to foreign countries is a reason the U.S. economy is struggling and more people aren't being hired".
The Pew Center reported poll results in August 2012: "Fully 85% of self-described middle-class adults say it is more difficult now than it was a decade ago for middle-class people to maintain their standard of living. Of those who feel this way, 62% say "a lot" of the blame lies with Congress, while 54% say the same about banks and financial institutions, 47% about large corporations, 44% about the Bush administration, 39% about foreign competition and 34% about the Obama administration."
2008–2009 debates
The debate around the American Recovery and Reinvestment Act of 2009 (ARRA), the approximately $800 billion stimulus bill passed due to the subprime mortgage crisis, highlighted these views. Democrats generally advocated the liberal position and Republicans advocated the conservative position. Republican pressure reduced the overall size of the stimulus while increasing the ratio of tax cuts in the law.
These historical positions were also expressed during the debate around the Emergency Economic Stabilization Act of 2008, which authorized the Troubled Asset Relief Program (TARP), an approximately $700 billion bailout package (later reduced to $430 billion) for the banking industry. The initial attempt to pass the bill failed in the House of Representatives due primarily to Republican opposition. Following a significant drop in the stock market and pressure from a variety of sources, a second vote passed the bill in the House.
Creating American Jobs and Ending Offshoring Act
Senator Dick Durbin proposed a bill in 2010 called the "Creating American Jobs and Ending Offshoring Act" that would have reduced tax advantages from relocating U.S. plants abroad and limited the ability to defer profits earned overseas. However, the bill was stalled in the Senate primarily due to Republican opposition. It was supported by the AFL-CIO but opposed by the U.S. Chamber of Commerce.
The Congressional Research Service summarized the bill as follows: "Creating American Jobs and Ending Offshoring Act—Amends the Internal Revenue Code to: (1) exempt from employment taxes for a 24-month period employers who hire a employee who replaces another employee who is not a citizen or permanent resident of the United States and who performs similar duties overseas; (2) deny any tax deduction, deduction for loss, or tax credit for the cost of an American jobs offshoring transaction (defined as any transaction in which a taxpayer reduces or eliminates the operation of a trade or business in connection with the start-up or expansion of such trade or business outside the United States); and (3) eliminate the deferral of tax on income of a controlled foreign corporation attributable to property imported into the United States by such corporation or a related person, except for property exported before substantial use in the United States and for agricultural commodities not grown in the United States in commercially marketable quantities."
American Jobs Act
President Barack Obama proposed the American Jobs Act in September 2011, which included a variety of tax cuts and spending programs to stimulate job creation. The White House provided a fact sheet which summarized the key provisions of the $447 billion bill. However, neither the House nor the Senate has passed the legislation as of December 2012. President Obama stated in October 2011: "In the coming days, members of Congress will have to take a stand on whether they believe we should put teachers, construction workers, police officers and firefighters back on the job...They'll get a vote on whether they believe we should protect tax breaks for small business owners and middle-class Americans, or whether we should protect tax breaks for millionaires and billionaires."
Fiscal cliff
During 2012, there was significant debate regarding approximately $560 billion in tax increases and spending cuts scheduled to go into effect in 2013, which would reduce the 2013 budget deficit roughly in half. Critics argued that with an employment crisis, such fiscal austerity was premature and misguided. The Congressional Budget Office projected that such sharp deficit reduction would likely cause the U.S. to enter recession in 2013, with the unemployment rate rising to 9% versus approximately 8% in 2012, costing over 1 million jobs. The fiscal cliff was partially addressed by the American Taxpayer Relief Act of 2012.
Individual income taxes
The historical record indicates that marginal income tax rate changes have little impact on job creation, economic growth or employment.
The Center on Budget and Policy Priorities (CBPP) wrote in March 2009: "Small business employment rose by an average of 2.3 percent (756,000 jobs) per year during the Clinton years, when tax rates for high-income filers were set at very similar levels to those that would be reinstated under President Obama's budget. But during the Bush years, when the rates were lower, employment rose by just 1.0 percent (367,000 jobs)." CBPP reported in September 2011 that both employment and GDP grew faster in the seven-year period following President Clinton's income tax rate increase of 1993, than a similar period after the Bush tax cuts of 2001.
Corporate income taxes
Conservatives typically argue for lower U.S. tax income rates, arguing that it would encourage companies to hire more workers. Liberals have proposed legislation to tax corporations that offshore jobs and to limit corporate tax expenditures.
U.S. corporate after-tax profits were at record levels during 2012 while corporate tax revenue was below its historical average relative to GDP. For example, U.S. corporate after-tax profits were at record levels during the third quarter of 2012, at an annualized $1.75 trillion. U.S. corporations paid approximately 1.2% GDP in taxes during 2011. This was below the 2.7% GDP level in 2007 pre-crisis and below the 1.8% historical average for the 1990–2011 period. In comparing corporate taxes, the Congressional Budget Office found in 2005 that the top statutory tax rate was the third highest among OECD countries behind Japan and Germany. However, the U.S. ranked 27th lowest of 30 OECD countries in its collection of corporate taxes relative to GDP, at 1.8% vs. the average 2.5%.
Solutions for creating more U.S. jobs
A variety of options for creating jobs exist, but these are strongly debated and often have tradeoffs in terms of additional government debt, adverse environmental impact, and impact on corporate profitability. Examples include infrastructure investment, tax reform, healthcare cost reduction, energy policy and carbon price certainty, reducing the cost to hire employees, education and training, deregulation, and trade policy. Authors Bittle & Johnson of Public agenda explained the pros and cons of 14 job creation arguments frequently discussed, several of which are summarized below by topic. These are hotly debated by experts from across the political spectrum.
Infrastructure investment
Many experts advocate infrastructure investment, such as building roads and bridges and upgrading the electricity grid. Such investments have historically created or sustained millions of jobs, with the offset to higher state and federal budget deficits. In the wake of the 2008–2009 recession, there were over 2 million fewer employed housing construction workers. The American Society of Civil Engineers rated U.S. infrastructure a "D+" on their scorecard for 2013, identifying an estimated $3.6 trillion in investment ideas by 2020.
CBO estimated in November 2011 that increased investment in infrastructure would create between 1 and 6 jobs per $1 million invested; in other words, a $100 billion investment would generate between 100,000 and 600,000 additional jobs. President Obama proposed the American Jobs Act in 2011, which included infrastructure investment and tax breaks offset by tax increases on high income earners. However, it did not receive sufficient support in the Senate to receive a floor vote. During late 2015, the House and Senate, in rare bipartisan form, passed the largest infrastructure package in a decade, costing $305 billion over five years, less than the $478 billion in Obama's initial request. He signed the Fixing America’s Surface Transportation Act into law in December 2015.
Tax policy
Lowering the costs of workers also encourages employers to hire more. This can be done via reducing existing Social Security or Medicare payroll taxes or by specific tax incentives for hiring additional workers. CBO estimated in 2011 that reducing employers' payroll taxes (especially if limited to firms that increase their payroll), increasing aid to the unemployed, and providing additional refundable tax credits to lower-income households, would generate more jobs per dollar of investment than infrastructure.
President Obama reduced the Social Security payroll tax on workers during the 2011–2012 period, which added an estimated $100 billion to the deficit while leaving these funds with consumers to spend. The U.S. corporate tax rate is among the highest in the world, although U.S. corporations pay among the lowest amount relative to GDP due to loopholes. Reducing the rate and eliminating loopholes may make U.S. businesses more competitive, but may also add to the deficit. The Tax Policy Center estimated during 2012 that reducing the corporate tax rate from 35% to 20% would add $1 trillion to the debt over a decade, for example.
Lower healthcare costs
Businesses are faced with paying the significant and rising healthcare costs of their employees. Many other countries do not burden businesses, but instead tax workers who pay the government for their healthcare. This significantly reduces the cost of hiring and maintaining the work force.
Energy policy and carbon price certainty
Various studies place the cost of environmental regulations in the thousands of dollars per employee. Americans are split on whether protecting the environment or economic growth is a higher priority. Regulations that would add costs to petroleum and coal may slow the economy, although they would provide incentives for clean energy investment by addressing regulatory uncertainty regarding the price of carbon.
President Obama advocated a series of clean energy policies during June 2013. These included: Reducing carbon pollution from power plants; Continue expanding usage of clean energy; raising fuel economy standards; and energy conservation through more energy-efficient homes and businesses.
Employment policies and the minimum wage
Raising the minimum wage would provide households with more money to spend, in an era with record corporate profits and a reluctance of corporations to invest. Critics argue raising employment costs deters hiring. During 2009, the minimum wage was $7.25 per hour, or $15,000 per year, below poverty level for some families. The New York Times editorial board wrote in August 2013: "As measured by the federal minimum wage, currently $7.25 an hour, low-paid work in America is lower paid today than at any time in modern memory. If the minimum wage had kept pace with inflation or average wages over the past nearly 50 years, it would be about $10 an hour; if it had kept pace with the growth in average labor productivity, it would be about $17 an hour."
President Obama advocated raising the minimum wage during February 2013: "The President is calling on Congress to raise the minimum wage from $7.25 to $9 in stages by the end of 2015 and index it to inflation thereafter, which would directly boost wages for 15 million workers and reduce poverty and inequality...A range of economic studies show that modestly raising the minimum wage increases earnings and reduces poverty without jeopardizing employment. In fact, leading economists like Lawrence Katz, Richard Freeman, and Laura Tyson and businesses like Costco, Wal-Mart, and Stride Rite have supported past increases to the minimum wage, in part because increasing worker productivity and purchasing power for consumers will also help the overall economy."
The Economist wrote in December 2013: "A minimum wage, providing it is not set too high, could thus boost pay with no ill effects on jobs...America's federal minimum wage, at 38% of median income, is one of the rich world's lowest. Some studies find no harm to employment from federal or state minimum wages, others see a small one, but none finds any serious damage."
The U.S. minimum wage was last raised to $7.25 per hour in July 2009. As of December 2013, there were 21 states with minimum wages above the Federal minimum, with the State of Washington the highest at $9.32. Ten states index their minimum wage to inflation.
The CBO reported in February 2014 that increasing the minimum wage to $10.10 per hour between 2014 and 2016 would reduce employment by an estimated 500,000 jobs, while about 16.5 million workers would have higher pay. A smaller increase to $9.00 per hour would reduce employment by 100,000, while about 7.6 million workers would have higher pay.
Regulatory reform
Regulatory costs on business start-ups and going concerns are significant. Requiring laws to have sunset provisions (end-dates) would help ensure only worthwhile regulations are renewed. New businesses account for about one-fifth of new jobs added. However, the number of new businesses starting each year dropped by 17% after the recession. Inc. magazine published 16 ideas to encourage new startups, including cutting red tape, approving micro-loans, allowing more immigration, and addressing tax uncertainty.
Education policy
Education policy reform could make higher education more affordable and more attuned to job needs. Unemployment is considerably lower for those with a college education. However, college is increasingly unaffordable. Providing loans contingent on degrees focused on fields with worker shortages such as healthcare and accounting would address structural workforce imbalances (i.e., a skills mismatch). Federal Reserve Chair Janet Yellen stated in 2014: "Public funding of education is another way that governments can help offset the advantages some households have in resources available for children. One of the most consequential examples is early childhood education. Research shows that children from lower-income households who get good-quality pre-Kindergarten education are more likely to graduate from high school and attend college as well as hold a job and have higher earnings, and they are less likely to be incarcerated or receive public assistance."
Income inequality
Income inequality, expressed by wage stagnation for middle- and lower-income families coupled with a shift in income growth to the top earners, can adversely affect economic growth, as wealthier families tend to save more. The quality or pay of the job matters, not just creating more jobs. The union movement has declined considerably, one factor contributing to more income inequality and off-shoring. Reinvigorating the labor movement could help create more higher-paying jobs, shifting some of the economic pie back to workers from owners. However, by raising employment costs, employers may choose to hire fewer workers.
Trade policy
Creating a level playing field with trading partners could help create more jobs in the U.S. Wage and living standard differentials and currency manipulation can make "free trade" something other than "fair trade." Requiring countries to allow their currencies to float freely on international markets would reduce significant trade deficits, adding jobs in developed countries such as the U.S. and Western Europe.
Long-term unemployment
CBO reported several options for addressing long-term unemployment during February 2012. Two short-term options included policies to: 1) Reduce the marginal cost to businesses of adding employees; and 2) Tax policies targeted towards people most likely to spend the additional income, mainly those with lower income. Over the long-run, structural reforms such as programs to facilitate re-training workers or education assistance would be helpful.
President's Council on Jobs and Competitiveness
President Obama established the President's Council on Jobs and Competitiveness in 2009. The Council released an interim report with a series of recommendations in October 2011. The report included five major initiatives to increase employment while improving competitiveness:
- Measures to accelerate investment into job-rich projects in infrastructure and energy development;
- A comprehensive drive to ignite entrepreneurship and accelerate the number and scale of young, small businesses and high-growth firms that produce an outsized share of America's new jobs;
- A national investment initiative to boost jobs-creating inward investment in the United States, both from global firms headquartered elsewhere and from multinational corporations headquartered here;
- Ideas to simplify regulatory review and streamline project approvals to accelerate jobs and growth; and,
- Steps to ensure America has the talent in place to fill existing job openings as well as to boost future job creation.
Analytical perspectives
Analyzing the true state of the U.S. labor market is very complex and a challenge for leading economists, who may arrive at different conclusions. For example, the main gauge, the unemployment rate, can be falling (a positive sign) while the labor force participation rate is falling as well (a negative sign). Further, the reasons for persons leaving the labor force may not be clear, such as aging (more people retiring) or because they are discouraged and have stopped looking for work. The extent to which persons are not fully utilizing their skills is also difficult to determine when measuring the level of underemployment.
A rough comparison of September 2014 (when the unemployment rate was 5.9%) versus October 2009 (when the unemployment rate peaked at 10.0%) helps illustrate the analytical challenge. The civilian population increased by roughly 10 million during that time, with the labor force increasing by about 2 million and those not in the labor force increasing by about 8 million. However, the 2 million increase in the labor force represents the net of an 8 million increase in those employed, partially offset by a 6 million decline in those unemployed. So is the primary cause of improvement in the unemployment rate due to: a) increased employment of 8 million; or b) the increase in those not in the workforce, also 8 million? Did the 6 million fewer unemployed obtain jobs or leave the workforce?
Labor market recovery following 2007–2009 recession
CBO issued a report in February 2014 analyzing the causes for the slow labor market recovery following the 2007–2009 recession. CBO listed several major causes:
Comparison of employment recovery across recessions and financial crises
One method of analyzing the impact of recessions on employment is to measure the period of time it takes to return to the pre-recession employment peak. By this measure, the 2008–2009 recession was considerably worse than the five other U.S. recessions from 1970 to present. By May 2013, U.S. employment had reached 98% of its pre-recession peak after approximately 60 months. Employment recovery following a combined recession and financial crisis tends to be much longer than a typical recession. For example, it took Norway 8.5 years to return to its pre-recession peak employment after its 1987 financial crisis and it took Sweden 17.8 years after its 1991 financial crisis. The U.S. is recovering considerably faster than either of these countries.
Share of full-time and part-time workers
The ratio of full-time workers was 86.5% in January 1968 and hit a historical low of 79.9% in January 2010. There is a long-term trend of gradual reduction in the share of full-time workers since 1970, with recessions resulting in a decline in the full-time share of the workforce faster than the overall trend, with partial reversal during recovery periods. For example, as a result of the 2007–2009 recession, the ratio of full-time employed to total employed fell from 83.1% in December 2007 to a trough of 79.9% in January 2010, before steadily rising to 81.6% by April 2016. Stated another way, the share of part-time employed to total employed rose from 16.9% in December 2007 to a peak of 20.1% in January 2010, before steadily falling to 18.4% in April 2016.
There is a trend towards more workers in alternative (part-time or contract) work arrangements rather than full-time; the percentage of workers in such arrangements rose from 10.1% in 2005 to 15.8% in late 2015. This implies all of the net employment growth in the U.S. economy (9.1 million jobs between 2005 and 2015) occurred in alternative work arrangements, while the number in traditional jobs slightly declined.
Estimates
Estimates vary for the number of jobs that must be created to absorb the inflow of persons into the labor force, to maintain a given rate of unemployment. This number is significantly affected by demographics and population growth. For example, economist Laura D'Andrea Tyson estimated this figure at 125,000 jobs per month during 2011.
Economist Paul Krugman estimated it around 90,000 during 2012, mentioning also it used to be higher. One method of calculating this figure follows, using data as of September 2012: U.S. population 314,484,000 x 0.90% annual population growth x 63% of population is working age x 63% work force participation rate / 12 months per year = 93,614 jobs/month. This approximates the Krugman figure.
Wells Fargo economists estimated the figure around 150,000 in January 2013: "Over the past three months, labor force participation has averaged 63.7 percent, the same as the average for 2012. If the participation rate holds steady, how many new jobs are needed to lower the unemployment rate? The steady employment gains in recent months suggest a rough answer. The unemployment rate has been 7.9 percent, 7.8 percent and 7.8 percent for the past three months, while the labor force participation rate has been 63.8 percent, 63.6 percent and 63.6 percent. Meanwhile, job gains have averaged 151,000. Therefore, it appears that the magic number is something above 151,000 jobs per month to lower the unemployment rate." Reuters reported a figure of 250,000 in February 2013, stating sustained job creation at this level would be needed to "significantly reduce the ranks of unemployed."
Federal Reserve analysts estimated this figure around 80,000 in June 2013: "According to our analysis, job growth of more than about 80,000 jobs per month would put downward pressure on the unemployment rate, down significantly from 150,000 to 200,000 during the 1980s and 1990s. We expect this trend to fall to around 35,000 jobs per month from 2016 through the remainder of the decade."
Empirical data
During the 41 months from January 2010 to May 2013, there were 19 months where the unemployment rate declined. On average, 179,000 jobs were created in those months. The median job creation during those months was 166,000.
International labor force size comparisons
The U.S. civilian labor force was approximately 155 million people during October 2012. This was the world's third largest, behind China (795.5 million) and India (487.6 million). The entire European Union employed 228.3 million.
Effect of disability recipients on labor force participation measures
The number of people receiving Social Security disability benefits (SSDI) increased from 7.1 million in December 2007 to 8.7 million in April 2012, a 22% increase. Recipients are excluded from the labor force. Economists at JPMorgan Chase & Co. and Morgan Stanley estimated this explained as much as 0.5 of the 2.0 percentage point decline in the U.S. labor-force participation rate during the period.
Effects on health and mortality
Unemployment can have adverse health effects. One study indicated that a 1% increase in the unemployment rate can increase mortality among working-aged males by 6%. Similar effects were not noted for women or the elderly, who had lower workforce attachment. The mortality increase was mainly driven by circulatory health issues (e.g., heart attacks). Another study concluded that: "Losing a job because of an establishment closure increased the odds of fair or poor health by 54%, and among respondents with no preexisting health conditions, it increased the odds of a new likely health condition by 83%. This suggests that there are true health costs to job loss, beyond sicker people being more likely to lose their jobs." Extended job loss can add the equivalent of ten years to a persons age.
Studies have also indicated that worsening economic conditions can be associated with lower mortality across the entire economy, with slightly lower mortality in the much larger employed group offsetting higher mortality in the unemployed group. For example, recessions might include fewer drivers on the road, reducing traffic fatalities and pollution.
Effects of healthcare reform
CBO estimated in December 2015 that the Patient Protection and Affordable Care Act (also known colloquially as "Obamacare") would reduce the labor supply by approximately 2 million full-time worker equivalents (measured as a combination of persons and hours worked) by 2025, relative to a baseline without the law. This is driven by the law's health insurance coverage expansions (e.g., subsidies and Medicaid expansion) plus taxes and penalties. With access to individual marketplaces, fewer persons are dependent on health insurance offered by employers.
Job growth projections 2014–2024
The U.S. Bureau of Labor Statistics (BLS) reported on December 8, 2015 its projections of job growth by industry and job type over the 2014–2024 period. Healthcare was the industry expected to add the most jobs. The top three occupations were: personal care aides with 458,100 jobs added or 26%; registered nurses with 439,300 or 16%; and home health aides with 348,400 or 38%. Fast food and retail were other industries with rapid growth. Only two of the top 10 occupations by number of projected jobs added required a bachelor's degree or higher, indicating much of the growth would be in lower-paying jobs.
Monthly jobs reports
U.S. employment statistics are reported by government and private primary sources monthly, which are widely quoted in the news media. These sources use a variety of sampling techniques that yield different measures.
Several secondary sources also interpret the primary data released.
Federal Reserve Database (FRED)
The FRED database contains a variety of employment statistics organized as data series. It can be used to generate charts or download historical information. Data series include labor force, employment, unemployment, labor force participation, etc. The Bureau of Labor Statistics (BLS) also releases employment statistics. Some popular data series include:
Job creation in the U.S. is typically measured by changes in the "Total Non-Farm" employees.
FRED has gathered many of the employment statistics on one page for easy access:
Unemployment rate forecasts
The Congressional Budget Office provides an unemployment rate forecast in its long term budget outlook. During August 2012, it projected that the unemployment rate would be 8.8% in 2013 and 8.7% in 2014. CBO projected the rate would then begin falling steadily to 5.5% by 2018 and remain around that level through 2022. This forecast assumes annual real GDP growth will exceed 3% between 2014 and 2018. During December 2012, Wells Fargo Economics forecast that the unemployment rate would be 7.8% in 2013 and 7.6% in 2014. This forecast assumes real GDP growth would be 1.4% in 2013 and 2.5% in 2014.
Off-shoring statistics
The Department of Labor's Employment and Training Administration (ETA) prepares an annual report on those petitioning for trade adjustment assistance, due to jobs lost from international trade. This represents a fraction of jobs actually off-shored and does not include jobs that are placed overseas initially or the collateral impact on surrounding businesses when, for example, a manufacturing plant moves overseas. During 2011, there were 98,379 workers covered by petitions filed with ETA. The figure was 280,873 in 2010, 201,053 in 2009 and 126,633 in 2008.