
 | ||
A two-dimensional graph is a set of points in two-dimensional space. If the points are real and if Cartesian coordinates are used, each axis depicts the potential values of a particular real variable. Often the variable on the horizontal axis is called x and the one on the vertical axis is called y, in which case the horizontal and vertical axes are sometimes called the x axis and y axis respectively. With real variables on the axes, each point in the graph depicts the values of two real variables.
Contents
- Graph of a function
- Graph of a non function relation
- Superimposed graphs of more than one function
- Graph of geometric shapes
- References
Alternatively, each point in a graph may depict the value of a single complex variable. In this case, the horizontal axis is called the real axis and depicts the potential values of the real part of the complex number, while the vertical axis is called the imaginary axis and depicts the potential values of the imaginary part of the complex number.
Graph of a function
If the relation between the two real variables is of the form
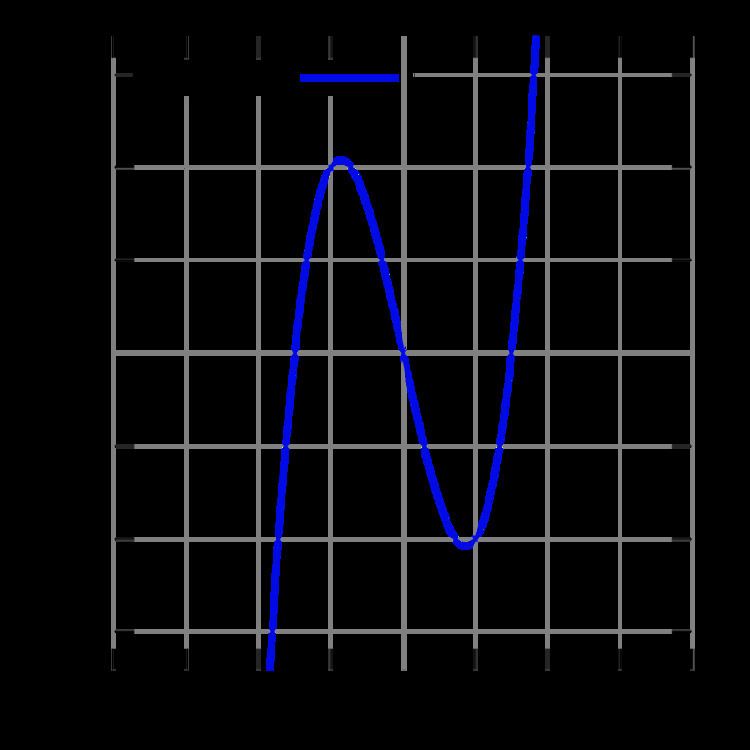
For example, the graph of the cubic polynomial
is
{(x, x3−9x) : x is a real number}.If this set is plotted on a Cartesian plane, the result is a curve (see figure).
Graph of a non-function relation
In some cases the relation between two real variables cannot be written in the form
An image of a plane curve is also a two-dimensional graph, although only some two-dimensional graphs are an image of any plane curve.
Superimposed graphs of more than one function
In some contexts it is useful to graph two or more functions together in the same diagram. An example is the supply and demand graph commonly used in economics, shown here.
Graph of geometric shapes
Two-dimensional geometric shapes are sets of points bounded by line segments or curves, so a shape can also be constructed by graphs of several equations of its boundary. Polygons are the shapes that are only bounded by line segments. These can be visualized by using two-dimensional graphs. Graphs of two polygons, a parallelogram and a right triangle, are shown here along with the graph of a circle.