
 | ||
Tropical cyclone windspeed climatology is the study wind distribution amongst tropical cyclones, a significant threat to land and people. Since records began in 1851, winds from hurricanes, typhoons and cyclones have been responsible for fatalities and damage in every basin. Major hurricanes (Category 3 or above) usually cause the most wind damage. Hurricane Andrew for example caused $45 billion (2005 USD) in damage, most of it wind damage.
Contents
- Winds in tropical cyclones
- Location of the winds
- Classification of the winds
- Beaufort wind scale
- Fastest windspeed per basin
- Australia
- Canada
- Japan
- Florida
- References
Although wind damage is common to tropical cyclones near landmasses, there are a few factors that lead to high wind speeds. Warm water temperatures, which was seen during Hurricane Wilma when it winds rapidly strengthened to 185 mph (295 km/h) in a 24-hour period due to the presence of abnormally warm water temperatures. Size and speed of the storm, which results in damage along a wide area as seen in Hurricane Isabel and Great New England Hurricane of 1938.
Winds in tropical cyclones
The winds in a tropical cyclone are the result of evaporation and condensation of moisture which results in updrafts. The updrafts in turn increase the height of the storm which causes more condensation.
Location of the winds
The strongest winds in a northern hemisphere tropical cyclone is located in the eyewall and the right front quadrant of the tropical cyclone. Severe damage is usually the result when the eyewall of a hurricane, typhoon or cyclone passes over land. The right front quadrant is also an area of a tropical cyclone were the winds are strongest. The reason that the winds are at the front right side of a storm in the northern hemisphere (and the front left hand side in the Southern Hemisphere) is because of the motion of a tropical cyclones motion contributing to its rotation. A 100 mph hurricane while stationary, might have winds of 100 mph on its right side in the northern hemisphere while the rest of the storm might have winds at 70 mph. The location of the right ( or left in the Southern Hemisphere) front quadrant also depends on the storm track. For example, in the northern hemisphere, if the storm was moving west, then the right side is to the north, if it moving north, then the strongest winds will be to the east of the center.
In the southern hemisphere, the strongest winds are to the left of the eye. That is because cyclonic winds below the equator, spin clockwise.
On occasion, strong winds and wind gusts can occur in the rain bands of a tropical cyclone. And inside the eye the winds are relatively calm. At higher altitudes, the winds within a tropical cyclone head away from the center, forming the outflow which produces the shape of the tropical cyclone.
Classification of the winds
The United States uses the Saffir–Simpson hurricane wind scale, a 1–5 scale which categorize hurricanes by sustained wind speed. The hurricane scale was created in 1969 by Herbert Saffir and Bob Simpson. The National Hurricane Center classifies hurricanes category 3 or above, major hurricanes. The Joint Typhoon Warning Center also uses a scale similar to the Saffir-Simpson Hurricane Scale. However, the JTWC classified typhoons with winds of at 150 mph or higher Supertyphoons.
The Bureau of Meteorology in Australia uses a 1–5 scale called tropical cyclone severity categories. Unlike the Saffir–Simpson Hurricane Scale, it categorizes tropical cyclones based on wind gusts.
Beaufort wind scale
Before the 1–5 scale was created in 1969 by the National Hurricane Center and later by the Bureau of Meteorology in Australia. Many tropical cyclones were simply ranked by the Beaufort Wind Scale which was created in the early 1800s by Francis Beaufort. The purpose of the scale was to standardize wind reports in ship logs. The scale was divided down into 14 forces (force 0 is calm while force 12 is hurricane).
Fastest windspeed per basin
This lists the fastest wind speed of a tropical cyclone per basin since 1950 (NOTE: All wind speeds are 1-minute sustained and are in mph).
Australia
In December 1998, Cyclone Thelma produced wind gusts of 108 mph (174 km/h) and sustained winds of 80 mph (139 km/h) as it made landfall in Western Australia. Three months later, Cyclone Vance produced a record gust of 166 mph (267 km/h). Sustained winds of 113 mph (182 km/h) in Onslow.
Cyclone John made landfall near Port Hedland, Australia as a category 4 tropical cyclone. Port Hedland experienced winds of 78 mph (124 km/h) for a period of 18 hours. At Karratha, the winds were gusting to 70 mph (113 km/h). Cape Lambert experienced sustained winds of 95 mph (150 km/h) for a five-hour period with gusts reaching 130 mph (210 km/h).
In March 2000, Tropical Storm Tessi made landfall near Townsville, Queensland,Australia. A weather station recorded the towns record wind gust of 81 mph (130 km/h).
Canada
A fast moving Hurricane Hazel brought sustained winds of 77 mph (124 km/h) and wind gusts up to 90 mph (150 km/h). The remnants of Hurricane Audrey brought 80 mph winds across southern Canada. A weather station on Nova Scotia recorded 100 mph sustained winds when Hurricane Juan made landfall in 2003.
Japan
During Typhoon Vera's impact on Japan, weather station in Iwo Jima reported winds of 89 mph (143 km/h).
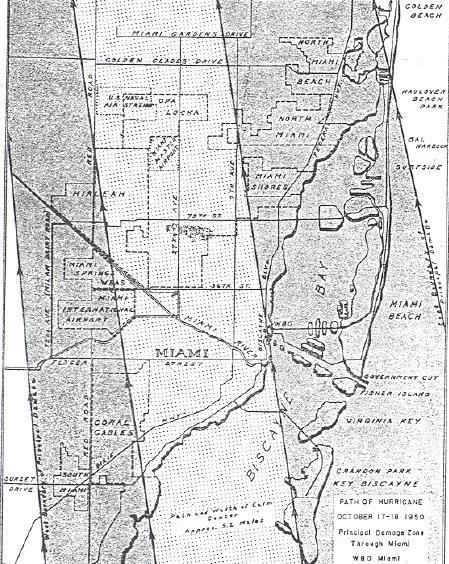
Florida
During Hurricane Wilma's passage through Florida a weather station recorded sustained windspeeds of 77 knots, gusting to 101 kts.