
 | ||
Tobin's q[1] (also known as Kaldor's v ) is the ratio between a physical asset's market value and its replacement value. It was first introduced by Nicholas Kaldor in 1966 in his article "Marginal Productivity and the Macro-Economic Theories of Distribution: Comment on Samuelson and Modigliani". It was then reintroduced in 1968 by James Tobin and William Brainard, although the use of the letter "q" did not appear until Tobin's 1969 article "A general equilibrium approach to monetary theory". Tobin (1977) writes
Contents
- Single company
- Aggregate corporations
- Application
- Other influences on q
- Nicholas Kaldor and the determination of Kaldors vTobins q
- Tobins marginal q
- Price to book ratio PB
- Criticism
- References
One, the numerator, is the market valuation: the going price in the market for exchanging existing assets. The other, the denominator, is the replacement or reproduction cost: the price in the market for the newly produced commodities. We believe that this ratio has considerable macroeconomic significance and usefulness, as the nexus between financial markets and markets for goods and services.
Single company
Although it is not the direct equivalent of Tobin's q, it has become common practice in the finance literature to calculate the ratio by comparing the market value of a company's equity and liabilities with its corresponding book values as the replacement values of a company's assets is hard to estimate:
Tobin's q =It is also common practise to assume equivalence of the liabilities market and book value, yielding:
Tobin's q =For stock listed companies, the market value of equity is often quoted in financial databases. It can be calculated for a specific point in time by
Aggregate corporations
Another use for q is to determine the valuation of the whole market in ratio to the aggregate corporate assets. The formula for this is:
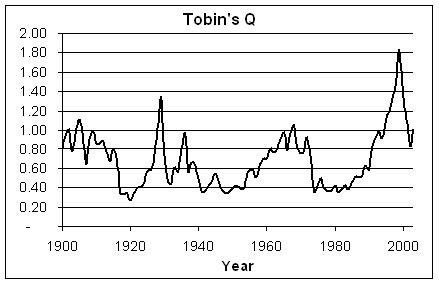
The following graph is an example of Tobin's q for all U.S. corporations. The line shows the ratio of the US stock market value to US net assets at replacement cost since 1900.
Application
If the market value reflected solely the recorded assets of a company, Tobin's q would be 1.0.
If Tobin's q is greater than 1.0, then the market value is greater than the value of the company's recorded assets. This suggests that the market value reflects some unmeasured or unrecorded assets of the company. High Tobin's q values encourage companies to invest more in capital because they are "worth" more than the price they paid for them.
If a company's stock price (which is a measure of the company's capital market value) is $2 and the price of the capital in the current market is $1, the company can issue shares and with the proceeds invest in capital. In this case q>1.
On the other hand, if Tobin's q is less than 1, the market value is less than the recorded value of the assets of the company. This suggests that the market may be undervaluing the company.
John Mihaljevic points out that "no straightforward balancing mechanism exists in the case of low Q ratios, i.e., when the market is valuing an asset below its replacement cost (Q<1). When Q is less than parity, the market seems to be saying that the deployed real assets will not earn a sufficient rate of return and that, therefore, the owners of such assets must accept a discount to the replacement value if they desire to sell their assets in the market. If the real assets can be sold off at replacement cost, for example via an asset liquidation, such an action would be beneficial to shareholders because it would drive the Q ratio back up toward parity (Q->1). In the case of the stock market as a whole, rather than a single firm, the conclusion that assets should be liquidated does not typically apply. A low Q ratio for the entire market does not mean that blanket redeployment of resources across the economy will create value. Instead, when market-wide Q is less than parity, investors are probably being overly pessimistic about future asset returns."
Lang and Stulz found out that diversified companies have a lower Q-ratio than focused firms because the market penalizes the value of the firm assets.
Tobin's discoveries show us that movements in stock prices will be reflected in changes in consumption and investment, although empirical evidence reveals that his discoveries are not as tight as one would have thought. This is largely because firms do not blindly base fixed investment decisions on movements in the stock price; rather they examine future interest rates and the present value of expected profits.
Other influences on q
Tobin's q measures two variables - the current price of capital assets as measured by accountants or statisticians and the market value of equity and bonds - but there are other elements that may affect the value of q, namely:
Tobin's q is said to be influenced by market hype and intangible assets so that we see swings in q around the value of 1.
Nicholas Kaldor and the determination of Kaldor's v/Tobin's q
In his 1966 paper "Marginal Productivity and the Macro-Economic Theory of Distribution: Comment on Samuelson and Modigliani" Nicholas Kaldor introduced this relationship as part of his broader theory, co-authored by Luigi Pasinetti, of a macroeconomic theory of distribution that was non-marginalist. This theory is today known as the Cambridge Growth Model after the location (Cambridge University, UK) where the theories was discovered. In the paper Kaldor writes:
The "valuation ratio" (v) [is] the relation of the market value of shares to the capital employed by corporations."
Kaldor then goes on to explore the properties of v at a properly macroeconomic level. He ends up deriving the following equation:
Where c is net consumption out of capital, sw is the savings of workers, g is the growth rate, Y is income, k is capital, sc is savings out out of capital and i is the fraction of new securities issued by firms. Kaldor then supplements this with a price, p, equation for securities which is as follows:
He then goes on to lay out his interpretation of these equations:
The interpretation of these equations is as follows. Given the savings-coefficients and the capital-gains-coefficient, there will be a certain valuation ratio which will secure just enough savings by the personal sector to take up the new securities issued by corporations. Hence the net savings of the personal sector (available for investment by the business sector) will depend, not only on the savings propensities of individuals, but on the policies of corporations towards new issues. In the absence of new issues the level of security prices will be established at the point at which the purchases of securities by the savers will be balanced by the sale of securities of the dis-savers, making the net savings of the personal sector zero. The issue of new securities by corporations will depress security prices (i.e. the valuation ratio v) just enough to reduce the sale of securities by the dis-savers sufficiently to induce the net savings required to take up the new issues. If i were negative and the corporations were net purchasers of securities from the personal sector (which they could be through the redemption of past securities, or purchasing shares from the personal sector for the acquisition of subsidiaries) the valuation ratio v would be driven up to the point at which net personal savings would be negative top the extent necessary to match the sale of securities by the personal sector.
Kaldor is clearly laying out equilibrium condition by which, ceteris paribus, the stock of savings in existence at any given time is matched to the total numbers of securities outstanding in the market. He goes on to state:
In a state of Golden Age equilibrium (given a constant g and a constant K/Y, however determined), v will be constant, with a value that can be ><1, depending on the values of sc, sw, c, and i.
In this sentence Kaldor is laying out the determination of the v ratio in equilibrium (a constant g and a constant K/Y) by: the savings out of capital, the savings of workers, net consumption out of capital and the issuance of new shares by firms.
Kaldor goes further still. Prior to this he had asserted that "the share of investment in total income is higher than the share of savings in wages, or in total personal income" is a "matter of fact" (i.e. a matter of empirical investigation that Kaldor thought would likely hold true). This is the so-called "Pasinetti inequality" and if we allow for it we can say something more concrete about the determination of v:
[One] can assert that, given the Pasinetti inequality, gK>sw.Y, v<1 when c=(1-sw). i=0; with i>0 this will be true a fortiori.
This fits nicely with the fact, which we have seen above, that Kaldor's v/Tobin's q tends on average to be below 1 thus suggesting that Pasinetti's inequality likely does hold in empirical reality.
Finally, Kaldor considers whether this exercise give us any clue to the future development of income distribution in the capitalist system. The neoclassicals tended to argue that capitalism would eventually liquidate the capitalists and lead to more homogenous income distribution. Kaldor lays out a case whereby this might take place in his framework:
Has this "neo-Pasinetti theorem" any very-long-run "Pasinetti" or "anti-Pasinetti" solution? So far we have not taken any account of the change in distribution of assets between "workers" (i.e. pension funds) and "capitalists" - indeed we assumed it to be constant. However since the capitalists are selling shares (if c>0) and the pension funds are buying them, one could suppose that the share of total assets in the hands of the capitalists would diminish continually, whereas the share of assets in the hands of the workers' funds would increase continuously until, at some distant day, the capitalists have no shares left; the pension funds and insurance companies would own them all!.
While this is a possible interpretation of the analysis Kaldor warns against it and lays out an alternative interpretation of the results:
But this view ignores that the ranks of the capitalist class are constantly renewed by the sons and daughters of the new Captains of Industry, replacing the grandsons and granddaughters of the older Captains who gradually dissipate their inheritance through living beyond their dividend income. It is reasonable to assume that the value of the shares of the newly formed and growing companies grows at a higher rate than the average, whilst those of older companies (which decline in relative importance) grow at a lower rate. This means that the rate of capital appreciation of the shares in the hands of the capitalist group as a whole, for the reasons given above, is greater than the rate of appreciation of the assets in the hands of pension funds, etc. Given the difference in the rates of appreciation of the two funds of securities-and this depends on the rate at which new corporations emerge and replace older ones-I think it can be shown that there will be, for any given constellation of the value of the parameters, a long run equilibrium distribution of the assets between capitalists and pension funds which will remain constant.
Kaldor's theory of v is comprehensive and provides an equilibrium determination of the variable based on macroeconomic theory that was missing in most other discussions. But today it is largely neglected and the focus is placed on Tobin's later contribution - hence the fact that the variable is known as Tobin's q and not Kaldor's v.
Tobin's marginal q
Tobin's marginal q, is the ratio of the market value of an additional unit of capital to its replacement cost.
Price-to-book ratio (P/B)
In inflationary times, Q will be lower than the price-to-book ratio. During periods of very high inflation, the book value would understate the cost of replacing a firm's assets, since the inflated prices of its assets would not be reflected on its balance sheet.
Criticism
Olivier Blanchard, Changyong Rhee and Lawrence Summers found with data of the US economy from the 1920s to the 1990s that "fundamentals" predict investment much better than Tobin's q. What these authors call fundamentals is however the rate of profit, which connects these empirical findings with older ideas of authors such as Wesley Mitchell, or even Karl Marx, that profits are the basic engine of the market economy.
Doug Henwood, in his book Wall Street, argues that the q ratio fails to accurately predict investment, as Tobin claims. "The data for Tobin and Brainard’s 1977 paper covers 1960 to 1974, a period for which q seemed to explain investment pretty well," he writes. "But as the chart [see right] shows, things started going away even before the paper was published. While q and investment seemed to move together for the first half of the chart, they part ways almost at the middle; q collapsed during the bearish stock markets of the 1970s, yet investment rose." (p. 145)