Rahul Sharma (Editor)

Timeline of the 1991 Pacific hurricane season

Updated on
Edit
Like
Comment
Share on FacebookTweet on TwitterShare on LinkedInShare on Reddit
Timeline of the 1991 Pacific hurricane season

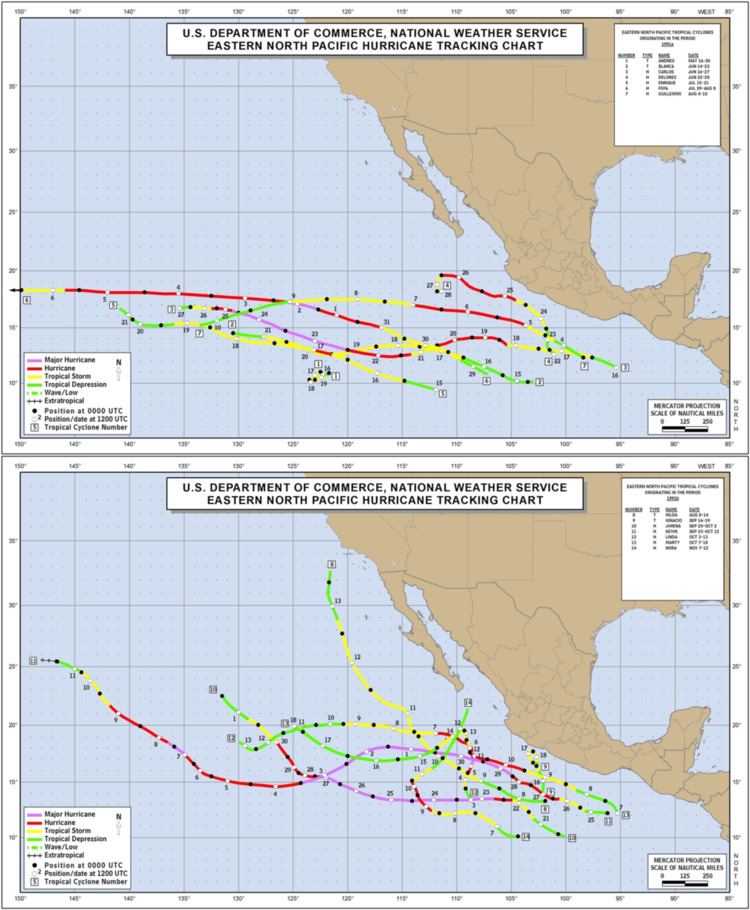
The 1991 Pacific hurricane season produced 16 tropical depressions, 14 of which became tropical storms or hurricanes. The season officially started on May 15, 1997 in the Eastern Pacific—designated as the area east of 140°W—and on June 1, 1997 in the Central Pacific, which is between the International Date Line and 140°W. The season officially ended in both basins on November 30, 1997. These dates typically limit the period of each year when most tropical cyclones form in the eastern Pacific basin. This timeline documents all the storm formations, strengthening, weakening, landfalls, extratropical transitions, as well as dissipation. The timeline also includes information which was not operationally released, meaning that information from post-storm reviews by the National Hurricane Center, such as information on a storm that was not operationally warned on, has been included.

Contents

The first storm formed on May 16 and the final storm dissipated on November 12, thus ending the season. There were 16 cyclones. including 2 tropical depressions that failed to reach tropical storm intensity. Ten storms in 1991 reached hurricane status, with five of these reached Category 3 intensity or higher on the Saffir-Simpson hurricane scale, thereby becoming major hurricanes.

None of the tropical storms or hurricanes made landfall, a tropical depression came ashore near Salina Cruz, Mexico, on the last day of June. The depression caused the only fatality of the season, injured five hundred, with two people missing. Delores, Ignacio and Marty threatened the coast of Mexico, coming close enough to require tropical cyclone watches and warnings. Of these, Ignacio was also responsible for 40 injuries as the system passed just offshore. Public advisories were issued for four other systems due to the threat of heavy rain along the Mexican coast.

May

May 15
  • The Eastern Pacific hurricane season officially begins.
  • May 16
  • 0600 UTC (11 p.m PDT) – A tropical depression forms.
  • May 17
  • 0000 UTC (5 p.m. PDT) – The depression strengthens into Tropical Storm Andres.
  • 1800 UTC (11 a.m. PDT) – Tropical Storm Andres peaks in intensity with winds of 65 mph (100 km/h).
  • May 19
  • 1800 UTC (11 a.m PDT) – Tropical Storm Andres weakens into a tropical depression.
  • May 20
  • 0600 UTC (11 p.m. PDT) – Tropical Depression Andres dissipates.
  • June

    June 1
  • The Central Pacific hurricane season officially begins.
  • June 14
  • 1800 UTC (11 a.m. PDT) – A tropical depression forms.
  • June 16
  • 1200 UTC (5 a.m. PDT) – A second tropical depression develops.
  • June 17
  • 0000 UTC (5 p.m PDT) – The former strengthens into Tropical Storm Blanca.
  • 0600 UTC (11 p.m PDT) – The latter strengthens into Tropical Storm Carlos.
  • June 18
  • 1800 UTC (5 a.m. PDT) – Tropical Storm Carlos strengthens into a hurricane.
  • June 20
  • 0000 UTC (5 p.m. PDT) – Tropical Storm Blanca peaks in intensity with winds of 65 mph (100 km/h).
  • June 21
  • 0000 UTC (5 p.m. PDT) – Hurricane Carlos weakens into a tropical storm.
  • 1200 UTC (5 a.m. PDT) – Tropical Storm Blanca weakens into a tropical depression.
  • 1800 UTC (11 a.m. PDT) – Tropical Storm Carlos restrengthens into a hurricane.
  • June 22
  • 0600 UTC (11 p.m. PDT) – Tropical Depression Blanca dissipates.
  • 1200 UTC (5 a.m. PDT) – Hurricane Carlos reaches Category 2 intensity.
  • 1200 UTC (5 a.m. PDT) – A tropical depression forms.
  • June 23
  • 0000 UTC (5 p.m. PDT) – Hurricane Carlos reaches Category 3 intensity.
  • June 24
  • 0000 UTC (5 p.m. PDT) – Tropical Depression Four-E strengthens into Tropical Storm Delores.
  • 0600 UTC (11 p.m. PDT) – Hurricane Carlos reaches its peak intensity of 120 mph (195 km/h).
  • June 25
  • 0600 UTC (11 p.m. PDT) – Hurricane Carlos weakens back to Category 2 intensity.
  • 0600 UTC (11 p.m. PDT) – Tropical Storm Delores intensifies into a hurricane.
  • 1800 UTC (11 a.m. PDT) – Hurricane Carlos weakens to Category 1 intensity.
  • June 26
  • 0000 UTC (11 p.m PDT) – Hurricane Delores peaks in intensity with 85 mph (140 km/h).
  • 0600 UTC (11 p.m PDT) – Hurricane Carlos weakens back into a tropical storm.
  • June 27
  • 0000 UTC (5 p.m. PDT) – Tropical Storm Carlos weakens into a tropical depression.
  • 0000 UTC (5 p.m. PDT) – Hurricane Delores degenerates into a tropical storm.
  • 1800 UTC (11 a.m. PDT)) – Tropical Depression Carlos dissipates.
  • June 28
  • 0000 UTC (5 p.m. PDT) – Tropical Storm Delores weakens into a tropical depression.
  • June 29
  • 0000 UTC (5 p.m. PDT) – Tropical Depression Delores dissipates.
  • 0830 UTC (1:30 a.m. PDT) – Tropical Depression Five-E forms.
  • 2030 UTC (2:30 p.m. PDT) – Tropical Depression Five-E makes landfall near Salina Cruz.
  • June 30
  • 0230 UTC (7:30 p.m. PDT) – Tropical Depression Five-E dissipates inland over Southern Mexico.
  • July

    July 15
  • 1200 UTC (5 a.m. PDT) – A tropical depression forms.
  • July 16
  • 0000 UTC (5 p.m. PDT) – The tropical depression strengthens into Tropical Storm Enrique.
  • July 17
  • 0600 UTC (11 p.m. PDT) – Tropical Storm Enrique strengthens into a hurricane and reaches its peak intensity of 75 mph (120 km/h).
  • 1200 UTC (5 a.m. PDT) – Hurricane Enrique weakens into a tropical storm.
  • July 19
  • 1800 UTC (11 a.m. PDT) – Tropical Storm Enrique weakens into a tropical depression.
  • July 21
  • 1200 UTC (5 a.m. PDT) – Tropical Depression Enrique crosses 140°W and enters the Central Pacific Hurricane Center's area of responsibility.
  • July 22
  • 0000 UTC (5 p.m PDT) – Tropical Depression Enrique dissipates.
  • July 29
  • 0600 UTC (11 p.m. PDT) – Another tropical depression forms.
  • 1800 UTC (11 a.m. PDT) – The depression is into Tropical Storm Fefa.
  • July 31
  • 1200 UTC (5 a.m. PDT) – Tropical Storm Fefa strengthens into a hurricane.
  • August

    August 1
  • 120 0UTC (5 a.m. PDT) – Hurricane Fefa reaches Category 2 intensity.
  • August 2
  • 0000 UTC (5 p.m. PDT) – Hurricane Fefa peaks in intensity with 120 mph (195 km/h) winds and reaches Category 3 intensity.
  • 1800 UTC (11 a.m. PDT) – Hurricane Fefa weakens to Category 2 intensity.
  • August 3
  • 0600 UTC (11 p.m. PDT) – Hurricane Fefa weakens to Category 1 intensity.
  • August 4
  • 0000 UTC (5 p.m PDT) – Hurricane Fefa regains Category 2 strength.
  • 0000 UTC (5 p.m PDT) – A tropical depression forms off the coast of Mexico.
  • 1800 U&TC (11 a.m. PDT) –The tropical depression is upgraded into Tropical Storm Guillermo.
  • August 5
  • 0600 UTC (11 p.m. PDT) – Hurricane Fefa crosses 140°W and enters the central Pacific.
  • 1200 UTC (5 a.m PDT) – Tropical Storm Guillermo rapidly reaches hurricane intensity.
  • August 6
  • 0600 UTC (11 p.m. PDT) – Hurricane Fefa weakens to a tropical storm.
  • 0600 UTC (11 p.m. PDT) – Hurricane Guillermo peaks in intensity with 80 mph (195 km/h) winds.
  • August 7
  • 1200 UTC (5 a.m. PDT) – Hurricane Guilermo weakens into a tropical storm.
  • 1800 UTC (11 a.m. PDT) – Tropical Storm Fefa weakens into a tropical depression.
  • August 8
  • 0000 UTC (5 p.m. PDT) – A tropical depression develops.
  • 0600 UTC (11 p.m. PDT) – Tropical Depression Fefa dissipates.
  • August 9
  • 1200 UTC (5 a.m. PDT) – Tropical Storm Guillermo weakens into a tropical depression.
  • 1200 UTC (5 a.m. PDT) – The tropical depression strengthens into Tropical Storm Hilda.
  • August 11
  • 0000 UTC (5 p.m PDT) – Tropical Depression Guillermo dissipates.
  • 0600 UTC (11 p.m PDT) – Tropical Storm Hilda reaches its peaks intensity of 65 mph (100 km/h).
  • August 13
  • 0000 UTC (5 p.m PDT) – Tropical Storm Hilda weakens into a tropical depression.
  • August 14
  • 1200 UTC (5 a.m PDT) – Tropical Depression Hilda dissipates.
  • September

    September 12
  • 1200 UTC (5:00 a.m. PDT) – Tropical Depression Ten-E develops.
  • September 14
  • 0000 UTC (5:00 p.m. PDT) – Tropical Depression Ten-E dissipates.
  • September 16
  • 0600 UTC (11:00 p.m. PDT) – A tropical depression forms.
  • 1800 UTC (11:00  a.m. PDT) – A tropical depression intensifies into Tropical Storm Ignacio.
  • September 17
  • 1800 UTC (11:00 a.m. PDT) – Tropical Storm Ignacio peaks in intensity with 65 mph (100 km/h).
  • September 19
  • 0000 UTC (5:00 p.m. PDT) – Tropical Storm Ignacio weakens into a tropical depression.
  • 0600 UTC (11:00 p.m PDT) – Tropical Depression Ignacio dissipates.
  • September 20
  • 1800 UTC (11:00 a.m. PDT) – A tropical depression develops.
  • September 21
  • 1800 UTC (11:00 a.m. PDT) – A tropical depression intensifies into Tropical Storm Jimena.
  • September 22
  • 1800 UTC (11:00 a.m. PDT) – Tropical Storm Jimena reaches hurricane status.
  • September 23
  • 0000 UTC (5:00 p.m. PDT) – Hurricane Jimena reaches Category 2 intensity.
  • 0600 UTC (11:00 p.m PDT) – Hurricane Jimena attains Category 3 status.
  • 1800 UTC (11:00 a.m. PDT) – Hurricane Jimena is upgraded into a Category 4 hurricane.
  • September 24
  • 1200 UTC (5:00 a.m. PDT) – Hurricane Jimena attains its peak intensity with winds of 135 mph (215 km/h).
  • September 25
  • 0000 UTC (5:00 p.m. PDT) – A tropical depression develops.
  • 1800 UTC (11:00 a.m. PDT) – The tropical depression is upgraded into Tropical Storm Kevin.
  • September 26
  • 0600 UTC (11:00 p.m. PDT) – Hurricane Jimena weakens back to Category 3 status.
  • 1800 UTC (11:00 a.m. PDT) – Tropical Storm Kevin reaches hurricane intensity.
  • September 27
  • 0600 UTC (11:00 p.m. PDT) – Hurricane Keven reaches Category 2 status.
  • 1800 UTC (11:00 a.m. PDT) – Hurricane Jimena is downgraded into a Category 2 hurricane.
  • September 29
  • 0600 UTC (11:00 p.m PDT) – Hurricane Kevin attains Category 3 status.
  • 1800 UTC (11:00 a.m. PDT) – Hurricanes Kevin reaches Category 4 intensity.
  • September 30
  • 0000 UTC (5:00 p.m. PDT) – Hurricane Jimena weakens into a Category 1 hurricane.
  • 1200 UTC (5:00 a.m. PDT) – Hurricane Jimena weakens into a tropical storm.
  • October

    October 1
  • 0000 UTC (5:00 p.m. PDT) – Hurricane Kevin peaks in intensity with winds of 145 mph (230 km/h).
  • 0600 UTC (11:00 p.m. PDT) – Tropical Storm Jimena weakens back to a tropical depression.
  • October 2
  • 0600 UTC (11:00 p.m. PDT) – Tropical Depression Jimena dissipates.
  • 1800 UTC (11:00 a.m. PDT) – Hurricanes Kevin weakens into Category 3 intensity.
  • October 3
  • 1200 UTC (5:00 a.m. PDT) – A tropical depression forms.
  • October 4
  • 0000 UTC (5:00 p.m. PDT) – The tropical depression is upgraded into Tropical Storm Linda.
  • 0000 UTC (5:00 p.m. PDT) – Hurricane Kevin weakens to a Category 2 hurricane.
  • October 5
  • 0000 UTC (5:00 p.m. PDT) – Tropical Storm Linda reaches Category 1 intensity.
  • 0600 UTC (11:00 p.m PDT) – Hurricane Kevin weakens to a Category 1 hurricane.
  • 0600 UTC (11:00 p.m PDT) – Hurricane Linda strengthens to a Category 2 hurricane.
  • 1200 UTC (5:00 a.m. PDT) – Hurricane Linda strengthens to a Category 3 hurricane.
  • 1800 UTC (11:00 a.m. PDT) – Hurricanes Linda peaks in intensity with 120 mph (295 km/h).
  • October 6
  • 0600 UTC (11:00 p.m PDT) – Hurricane Linda weakens to a Category 2 hurricane.
  • 1200 UTC (5:00 a.m. PDT) – Hurricane Kevin strengthens to a Category 2 hurricane.
  • 1800 UTC (11:00 a.m. PDT) – Hurricane Linda weakens to a Category 1 hurricane.
  • October 7
  • 1200 UTC (5:00 a.m. PDT) – Hurricane Kevin strengthens to a Category 3 hurricane.
  • 1200 UTC (5:00 a.m. PDT) – Hurricane Linda weakens to a tropical storm.
  • 1200 UTC (5:00 a.m. PDT) – A tropical depression develops.
  • 1800 UTC (11:00 a.m. PDT) – A tropical depression is upgraded to Tropical Storm Marty.
  • October 8
  • 0600 UTC (11:00 p.m PDT) – Hurricane Kevin weakens to a Category 2 hurricane.
  • October 9
  • 0000 UTC (5:00 p.m. PDT) – Hurricane Kevin weakens to a Category 1 hurricane.
  • 1800 UTC (11:00 a.m. PDT) – Hurricane Kevin weakens to a tropical storm.
  • 1800 UTC (11:00 a.m. PDT) – Tropical Storm Linda weakens to a tropical depression.
  • October 10
  • 0600 UTC (11:00 p.m PDT) – Tropical Storm Marty becomes a hurricane.
  • October 11
  • 0600 UTC (11:00 p.m PDT) – Tropical Storm Kevin weakens to a tropical depression.
  • 1800 UTC (11:00 a.m. PDT) – Hurricanes Marty peaks in intensity with 80 mph (135 km/h).
  • October 12
  • 0600 UTC (11:00 p.m PDT) – Tropical Depression Kevin transactions into an extratropical cyclone, an unusual occurrence for a Pacific hurricane.
  • 1800 UTC (11:00 a.m. PDT) – Hurricane Marty weakens into a tropical storm.
  • October 14
  • 0000 UTC (5:00 p.m. PDT) – Tropical Depression Linda dissipates.
  • October 15
  • 0600 UTC (11:00 p.m PDT) – Tropical Storm Marty weakens to a tropical depression.
  • October 18
  • 1800 UTC (11:00 a.m. PDT) – Tropical Depression Marty ceases to exist.
  • November

    November 7
  • 0000 UTC (5:00 p.m. PDT) – The final tropical depression of the season forms.
  • 1200 UTC (5:00 a.m. PDT) – The tropical depression is upgraded into Tropical Storm Nora by the National Hurricane Center.
  • November 9
  • 0600 UTC (11:00 p.m PDT) – Tropical Storm Nora strengthens to a Category 1 hurricane.
  • 1800 UTC (11:00 a.m. PDT) – Hurricane Nora intensifies into a Category 2 hurricane.
  • November 10
  • 0000 UTC (5:00 p.m. PDT) – Hurricane Nora reaches its peak intensity of 105 mph (165 km/h).
  • 1800 UTC (11:00 a.m. PDT) – Hurricane Nora weakens to a Category 1 hurricane.
  • 0000 UTC (5:00 p.m. PDT) – Hurricane Nora weakens back to a tropical storm.
  • November 11
  • 1800 UTC (11:00 a.m. PDT) – Tropical Storm Nora weakens to a tropical depression.
  • November 13
  • 0000 UTC (5:00 p.m. PDT) – Tropical Depression Nora dissipates.
  • References

    Timeline of the 1991 Pacific hurricane season Wikipedia