
 | ||
Thermal desorption spectroscopy (TDS), also known as temperature programmed desorption (TPD) is the method of observing desorbed molecules from a surface when the surface temperature is increased. Many researchers prefer the name TPD because it is not a spectroscopic method.
Contents
Desorption
When molecules or atoms come in contact with a surface, they adsorb onto it, minimizing their energy by forming a bond with the surface. The binding energy varies with the combination of the adsorbate and surface. If the surface is heated, at one point, the energy transferred to the adsorbed species will cause it to desorb. The temperature at which this happens is known as the desorption temperature. Thus TDS shows information on the binding energy.
Measurement
Since TDS observes the mass of desorbed molecules, it shows what molecules are adsorbed on the surface. Moreover, TDS recognizes the different adsorption conditions of the same molecule from the differences between the desorption temperatures of molecules desorbing different sites at the surface, e.g. terraces vs. steps. TDS also obtains the amounts of adsorbed molecules on the surface from the intensity of the peaks of the TDS spectrum, and the total amount of adsorbed species is shown by the integral of the spectrum.
To measure TDS, one needs a mass spectrometer, such as a quadrupole mass spectrometer or a time-of-flight (TOF) mass spectrometer, under ultrahigh vacuum (UHV) conditions. The amount of adsorbed molecules is measured by increasing the temperature at a heating rate of typically 2 K/s to 10 K/s. Several masses may be simultaneously measured by the mass spectrometer, and the intensity of each mass as a function of temperature is obtained as a TDS spectrum.
The heating procedure is often controlled by the PID control algorithm, with the controller being either a computer or specialised equipment such as a Eurotherm.
Other methods of measuring desorption are Thermal Gravimetric Analysis (TGA) or using infrared detectors, thermal conductivity detectors etc.
Quantitative interpretation of TDS data
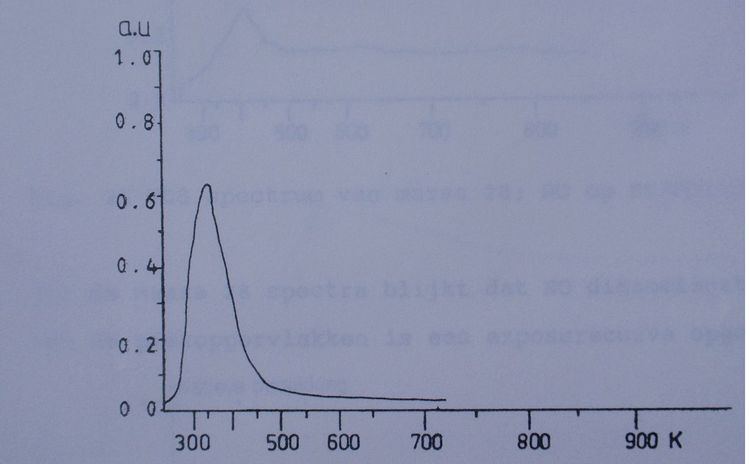
TDS spectrum 1 and 2 are typical examples of a TDS measurement. Both TDS are examples of NO desorbing from a single crystal in high vacuum. The crystal was mounted on a titanium filament and heated with current. The desorbing NO was measured using a mass spectrometer monitoring the atomic mass of 30.
Before 1990 analysis of a TDS spectrum was usually done using a so-called simplified method; the "Redhead" method, assuming the exponential prefactor and the desorption energy to be independent of the surface coverage. After 1990 and with use of computer algorithms TDS spectra were analyzed using the "complete analysis method" or the "leading edge method". These methods assume the exponential prefactor and the desorption energy to be dependent of the surface coverage. Several available methods of analyzing TDS are described and compared in an article by A.M. de JONG and J.W. NIEMANTSVERDRIET
Theoretical Introduction
Thermal desorption is described based on the Arrhenius equation.
where
This equation is difficult in daily practice while several variables are a function of the coverage and influence each other. The “complete analysis method” calculates the pre-exponential factor and the activation energy at several coverages. This calculation can be simplified. First we assume the pre-exponential factor and the activation energy to be independent of the coverage.
We also assume a linear heating rate:
(equation 1)
where:
We assume that the pump rate of the system is indefinitely large, thus no gasses will absorb during the desorption. The change in pressure during desorption is described as:
(equation 2)
where:
We assume that
(equation 3)
Equation 2 en 3 lead to conclude that the desorption rate is a function of the change in pressure. One can use data in an experiment, which are a function of the pressure like the intensity of a mass spectrometer, to determine the desorption rate.
Since we assumed the pre-exponential factor and the activation energy to be independent of the coverage. Thermal desorption is described with a simplified Arrhenius equation:
(equation 4)
where:
Using the before mentioned Redhead method (a method less precise as the "complete analysis" or the "leading edge" method) and the temperature maximum
(equation 5)
for n=1
(equation 6)
for n=2
M. Ehasi en K. Christmann have described a simple method to determine the activation energy of the second order. Equation 6 can be changed into:
(equation 6a)
where:
A graph of
Thus in a first-order reaction the