
 | ||
A tephigram is one of four thermodynamic diagrams commonly used in weather analysis and forecasting. The name evolved from the original name "T-
Description
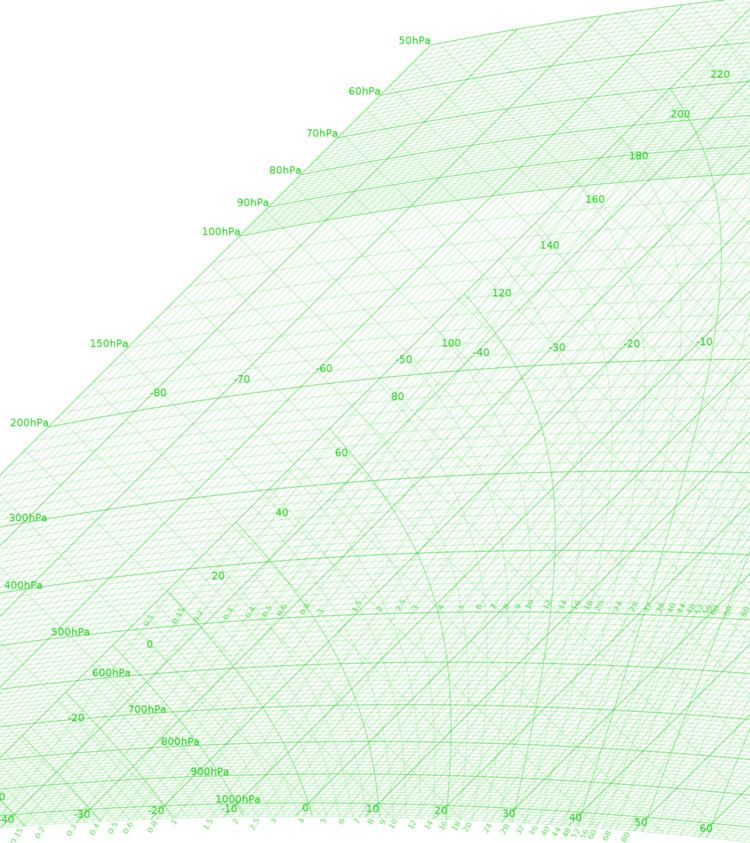
The tephigram was invented by Napier Shaw in 1915 and is used primarily in the United Kingdom and Canada. Other countries use similar thermodynamic diagrams for the same purpose however the details of their construction vary. In the tephigram, isotherms are straight and have a 45 degree inclination to the right while isobars are horizontal and have a slight curve. Dry adiabats are also straight and have a 45 degree inclination to the left while moist adiabats are curved.
The main reason that tephigrams are used by the British Met Office, the Meteorological Service of Canada, and Met Éireann (Irish Meteorological Service) is the property that areas contained by the curves have equal energies for equal areas, leading to better comparisons of CAPE and hence convective systems.