
 | ||
A Tauc plot is used to determine the optical bandgap, or Tauc gap, in semiconductors. The Tauc gap is often used to characterize practical optical properties of amorphous materials.
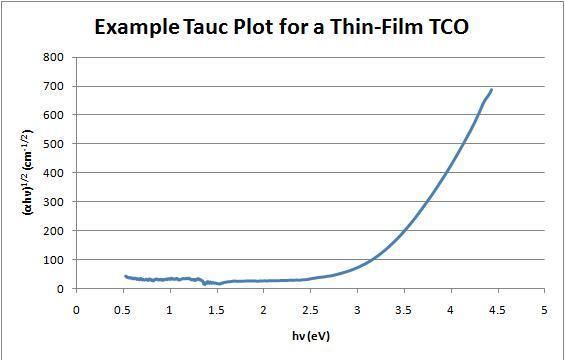
Jan Tauc (/taʊts/) showed that the optical absorption spectrum of amorphous germanium resembles the spectrum of the indirect transitions in crystalline germanium (plus a tail due to localized states at lower energies), and proposed an extrapolation to find the optical gap of these crystalline-like states. Typically, a Tauc plot shows the quantity hν (the energy of the light) on the abscissa and the quantity (αhν)1/r on the ordinate, where α is the absorption coefficient of the material. The value of the exponent r denotes the nature of the transition:
The resulting plot has a distinct linear regime which denotes the onset of absorption. Thus, extrapolating this linear region to the abscissa yields the energy of the optical band gap of the material.