
 | ||
Supercritical Adsorption also referred to as the adsorption of supercritical fluids, is the adsorption at above-critical temperatures. There are different tacit understandings of supercritical fluids. For example, “a fluid is considered to be ‘supercritical’ when its temperature and pressure exceed the temperature and pressure at the critical point”. In the studies of supercritical extraction, however, “supercritical fluid” is applied for a narrow temperature region of 1-1.2
Contents
History
Observations of supercritical adsorption reported before 1930 was covered in studies by McBain and Britton. All of the important articles on this subject published between 1930 and 1966 have been reviewed by Menon. During the last 20 years, a growing interest in supercritical adsorption research under the impetus of the quest for clean alternative fuels has been observed. Considerable progress has been made in both adsorption measurement techniques and molecular simulation of adsorption on computers, rendering new insights into the nature of supercritical adsorption.
Properties
According to the adsorption behavior, the adsorption of gases on solids can be classified into three temperature ranges relative to
1.Subcritical region (T<
2.Near-critical region (
3.The region T>
Isotherms in the first region will show the feature of subcritical adsorption. Isotherms in the second region will show the feature of mechanism transition. Isotherms in the third region will show the feature of supercritical adsorption. The transition will take a continuous way if the isotherms in both sides of the critical temperature belong to the same type, such as adsorption on microporous activated carbon. However, discontinuous transition could be observed on isotherms in the second region if there is a transformation of isotherm types, such as adsorption on mesoporous silica gel. The decisive factor in such a classification of adsorption is merely temperature, irrespective of pressure. This is because a fluid cannot undergo a transition to a liquid phase at above-critical temperature, regardless of the pressure applied. This fundamental law determines the different adsorption mechanism for the subcritical and supercritical regions. For the subcritical region, the highest equilibrium pressure of adsorption is the saturation pressure
Acquisition of supercritical adsorption isotherms
An adsorption isotherm depicts the relation between the quantity adsorbate and the bulk phase pressure (or density) at equilibrium for a constant temperature. It is a dataset of specified adsorption equilibrium. Such equilibrium data are required for optimal design of process relying on adsorption and are considered fundamental information for theoretical studies.
1. Measurement of Gas/Solid Adsorption Equilibriums
Volumetric Method
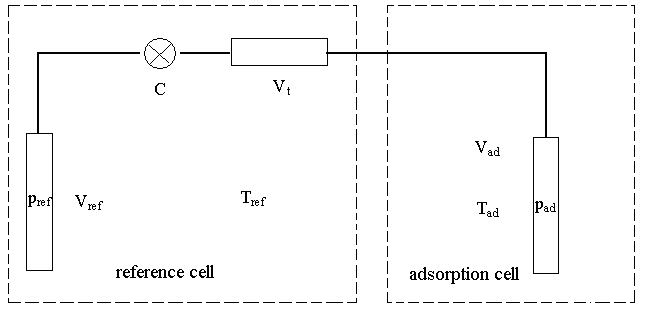
Volumetric method was used in the early days of adsorption studies by Langmuir, Dubinin and others. It basically comprises a gas expansion process from a storage vessel (reference cell) to an adsorption chamber including adsorbent (adsorption cell) through a controlling valve C, as schematically shown in Figure 1. The reference cell with volume
The amount adsorbed can be calculated from the pressure readings before and after opening valve C based on the p-V-T relationship of real gases. A dry and degassed adsorbent sample of known weight was enclosed in the adsorption cell. An amount of gas is let into
The pressure drops to
The amount adsorbed or the excess adsorption N is then obtained:
where
The main advantages of this method are simplicity in procedure, commercial availability of instruments, and the large ranges of pressure and temperature in which this method can be realized. The disadvantage of volumetric measurements is the considerable amount of adsorbent sample needed to overcome adsorption effects on the walls of the vessels. However, this may be a positive aspect if the sample is adequate. A larger amount of sample results in considerable adsorption and usually provides a larger void space in the adsorption cell, rendering the effect of uncertainty in “dead space” to a minimum.
Gravimetric Method
In gravimetric method, the weight change of the adsorbent sample in the gravity field due to adsorption from the gas phase is recorded. Various types of sensitive microbalance have been developed for this purpose. A continuous-flow gravimetric technique coupled with wavelet rectification allows for higher precision, especially in the near-critical region.
Major advantages of gravimetric method include sensitivity, accuracy, and the possibility of checking the state of activation of an adsorbent sample. However, consideration must be given to buoyancy correction in gravimetric measurement. A counterpart is used for this purpose. The solid sample is placed in a sample holder on one arm of the microbalance while the counterpart is loaded on the other arm. Care must be taken to keep the volume of the sample and the counterpart as close as possible to reduce the buoyancy effect. The system is vacuumed and the balance is zeroed before starting experiments. Buoyancy is measured by introducing helium and pressurizing up to the highest pressure of the experiment. It is assumed that helium does not adsorb and any weight change (ΔW) is due to buoyancy. Knowing the density of helium (
The measured weight can be corrected for the buoyancy effect at a specified temperature and pressure:
2. Generating Isotherms by Molecular Simulation of Adsorption
Monte Carlo and molecular dynamic approaches became useful tools for theoretical calculations aiming at predictions of adsorption equilibriums and diffusivities in small pores of various simple geometries. The interactions between adsorbate molecules are represented by the Lenard-Jones potential:
where r is the interparticle distance,
Experimental Isotherms of the Supercritical Region
L Zhou and coworkers used a volumetric apparatus to measure the adsorption equilibriums of hydrogen and methane on activated carbon (Figure 2, 3). They also measure the adsorption equilibriums of nitrogen on microporous activated carbon (Figure 4) and on a mesoporous silica gel (Figure 5) for both subcritical and supercritical region. Figure 6 shows the isotherms of methane on silica gel.
Future problems
Adsorption of fluid at above-critical temperatures and elevated pressures is a field growing importance in both science and engineering. It is the physicochemical basis of many engineering processes and potential industrial applications. For example, separation or purification of light hydrocarbons, storage of fuel gases in microporous solids, adsorption from supercritical gases in extraction processes and chromatography. Besides, knowledge of gas/solid interface phenomenon at high pressures is fundamental to heterogeneous catalysis. However, the limited number of reliable high-pressure adsorption data hampered the progress of the theoretical study.
At least two problems have to be solved before a consistent system of theories for supercritical adsorption becomes sophisticated: first, how to set up a thermodynamically standard state for the supercritical adsorbed phase, so that the adsorption potential for supercritical adsorption can be evaluated? Second, how to determine the total amount in the adsorbed phase based on experimentally measured equilibrium data. Determination of the absolute adsorption is needed for establishing thermodynamic theory because as a reflection of statistical behavior of molecules, thermodynamic rules must rely on the total, not part of, material confined in the system studied.
From recent studies of supercritical adsorption, there seems to be an end in the high-pressure direction for supercritical adsorption. However, adsorbed-phase density is the decisive factor for the existence of this end. The state of adsorbate at the “end” provides the standard state of the supercritical adsorbed phase just like the saturated liquid, which is the end state of adsorbate in the subcritical adsorption. So the “end state” has to be precisely defined. To establish a definite relationship for the adsorbed phase density at the end state, abundant and reliable experimental data are still required.