
 | ||
A Stiff diagram, or Stiff pattern, is a graphical representation of chemical analyses, first developed by H.A. Stiff in 1951. It is widely used by hydrogeologists and geochemists to display the major ion composition of a water sample. A polygonal shape is created from four parallel horizontal axes extending on either side of a vertical zero axis. Cations are plotted in milliequivalents per liter on the left side of the zero axis, one to each horizontal axis, and anions are plotted on the right side. Stiff patterns are useful in making a rapid visual comparison between water from different sources. An alternative to the Stiff diagram is the Maucha diagram.
Stiff diagrams can be used:
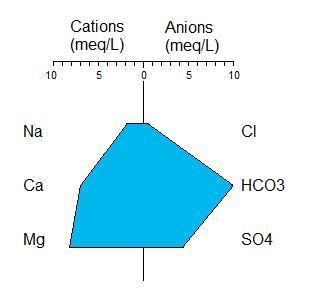
1) to help visualize ionically related waters from which a flow path can be determined, or;2) if the flow path is known, to show how the ionic composition of a water body changes over space and/or time.A typical Stiff diagram is shown in the figure (right). By standard convention, Stiff diagrams are created by plotting the equivalent concentration of the cations to the left of the center axis and anions to the right. The points are connected to form the figure. When comparing Stiff diagrams between different waters it is important to prepare each diagram using the same ionic species, in the same order, on the same scale.
Environmental laboratories typically report concentrations for anion and cation parameters using units of mass/volume, usually mg/L. In order to convert the mass concentration to an equivalent concentration the following mathematical relationship is used:
(mass concentration) * (ionic charge) / (molecular weight) = (equivalent concentration)For example, a water with a calcium concentration of 120 mg/L would have the following calcium equivalent concentration:
(120 mg/L) * (2 meq/mmol) / (40 mg/mmol) = 6 meq/L