
 | ||
A spaghetti plot (also known as a spaghetti chart, spaghetti diagram, or spaghetti model) is a method of viewing data to visualize possible flows through systems. Flows depicted in this manner appear like noodles, hence the coining of this term. This method of statistics was first used to track routing through factories. Visualizing flow in this manner can reduce inefficiency within the flow of a system. In regards to animal populations and weather buoys drifting through the ocean, they are drawn to study distribution and migration patterns. Within meteorology, these diagrams can help determine confidence in a specific weather forecast, as well as positions and intensities of high and low pressure systems. They are composed of deterministic forecasts from atmospheric models or their various ensemble members. Within medicine, they can illustrate the effects of drugs on patients during drug trials.
Contents
Biology
Spaghetti diagrams have been used to study why butterflies are found where they are, and to see how topographic features (such as mountain ranges) limit their migration and range. Within mammal distributions across central North America, these plots have correlated their edges to regions which were glaciated within the previous ice age, as well as certain types of vegetation.
Meteorology
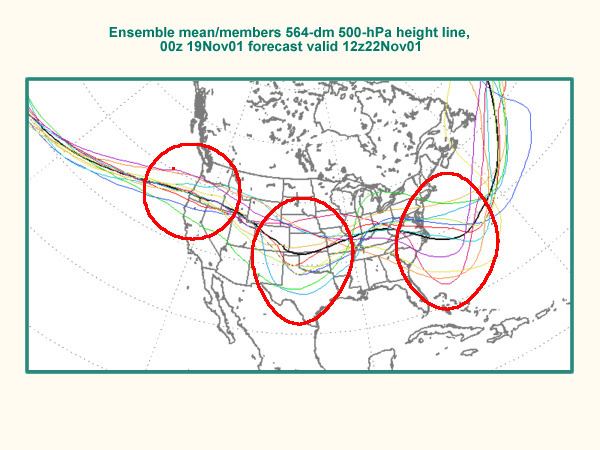
Within meteorology, spaghetti diagrams are normally drawn from ensemble forecasts. A meteorological variable e.g. pressure, temperature, or precipitation amount is drawn on a chart for a number of slightly different model runs from an ensemble. The model can then be stepped forward in time and the results compared and be used to gauge the amount of uncertainty in the forecast. If there is good agreement and the contours follow a recognizable pattern through the sequence, then the confidence in the forecast can be high. Conversely, if the pattern is chaotic i.e. resembling a plate of spaghetti then confidence will be low. Ensemble members will generally diverge over time and spaghetti plots are a quick way to see when this happens.
Spaghetti plots can be a more favorable choice compared to the mean-spread ensemble in determining the intensity of a coming cyclone, anticyclone, or upper level ridge or trough. Because ensemble forecasts naturally diverge as the days progress, the projected locations of meteorological features will spread further apart. A mean-spread diagram will take a mean of the calculated pressure from each spot on the map as calculated by each permutation in the ensemble, thus effectively smoothing out the projected low and making it appear broader in size but weaker in intensity than the ensemble's permutations had actually indicated. It can also depict two features instead of one if the ensemble clustering is around two different solutions.
Various forecast models within tropical cyclone track forecasting can be plotted on a spaghetti diagram to show confidence in five-day track forecasts. When track models diverge late in the forecast period, the plot takes on the shape of a squashed spider, and can be referred to as such in National Hurricane Center discussions. Within the field of climatology and paleotempestology, spaghetti plots have been used to correlate ground temperature information derived from boreholes across central and eastern Canada. Like in other disciplines, spaghetti diagrams can be used to show the motion of objects, such as drifting weather buoys over time.
Business
Spaghetti diagrams were first used to track routing through a factory. Spaghetti plots are a simple tool to visualize movement and transportation. Analyzing flows through systems can determine where time and energy is wasted, and identifies where streamlining would be beneficial. This is true not only with physical travel through a physical place, but also during more abstract processes such as the application of a mortgage loan.
Medicine
Spaghetti plots can be used to track the results of drug trials amongst a number of patients on one individual graph to determine their benefit. They have also been used to correlate progesterone levels to early pregnancy loss. The half-life of drugs within people's blood plasma, as well as discriminating effects between different populations, can be diagnosed quickly via these diagrams.