
 | ||
Social Media Analytics as a part of social analytics is the process of gathering data from stakeholder conversations on digital media and processing into structured insights leading to more information-driven business decisions and increased customer centrality for brands and businesses.
Contents
- Seven layers
- Process
- Data identification
- Data analysis
- Information interpretation
- Role in business intelligence
- Analytical tools
- Marketing
- Social commerce
- Methods
- Impacts on business intelligence
- References
"Social Media Analytics is the art and science of extracting valuable hidden insights from vast amounts of semi-structured and unstructured social media data to enable informed and insightful decision making. It is a science, as it involves systematically identifying, extracting, and analyzing social media data (such as tweets, shares, likes, and hyperlinks) using sophisticated tools and techniques. It is also an art, interpreting and aligning the insights gained with business goals and objectives. To get value from analytics, one should master both its art and science."
Social media analytics is an interdisciplinary area that is used in social science and computer sciences interchangeably. Social media analytics provide a human trace to the social scientist which could be used in wide spectrum of disciplines such as sociology, political sciences, and geology. Social media provides two broad contexts from social scientist perspective; it provides a wide range of data in already well established social science subjects such as political sciences and sociology, and social media sometimes is seen as a fundamental change in underlying assumptions of the social theory. Political scientists can follow unfolding political protest online and the exchange of information between communities of different languages. Meanwhile, it is very difficult to connect the social scientific understanding of social to social media data. For example, the concept of conventional friendship hardly applies to the concept of friendship in social media.
Seven layers
Social media at a minimum has seven layers of data. Out of the seven layers, some are visible or easily identifiable (e.g., text and actions), and other are invisible (e.g., social media and hyperlink networks).
Social media analytics can also be referred as social media listening, social media monitoring or social media intelligence.
Digital media sources for social media analytics include social media channels, blogs, forums, image sharing sites, video sharing sites, aggregators, classifieds, complaints, Q&A, reviews, Wikipedia and others.
Social media analytics is an industry agnostic practice and is commonly used in different approaches on business decisions, marketing, customer service, reputation management, sales and others. There is an array of tools that offers the social media analysis, varying from the level of business requirement. Logic behind algorithms that are designed for these tools is selection, data pre-processing, transformation, mining and hidden pattern evaluation.
In order to make the complete process of social media analysis a success it is important that key performance indicators (KPIs) for objectively evaluating the data is defined.
Social media analytics is important when one needs to understand the patterns that are hidden in large amount of social data related to particular brands.
Homophily is used as an apart of analytics, it is a tendency that a contact between similar people occurs at a higher rate than among dissimilar people. According to research, two users who follow reciprocally share topical interests by mining their thousands of links. All these are used for taking major business decision in social media sectors.
The success of social media monitoring (SMM) tools may vary from one company to another. According to Soleman and Cohard (2016), beyond technical factors related to social media monitoring (SMM) (quality of sources, functionalities, quality of the tool), organizations must also take into account the need for new capabilities, human, managerial and organizational skills to take advantage of their SMM tools.
Process
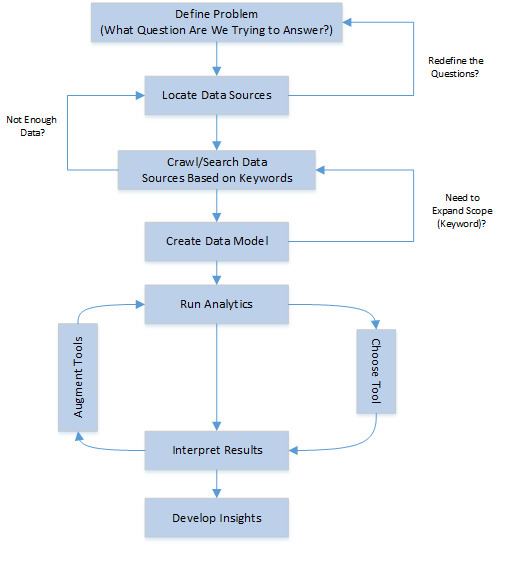
There are three main steps in social analyzing social media: data identification, data analysis, and information interpretation. The preferred way to maximize the value derived at every point during the process, analysts may define a question to be answered. In attempting to analyze the question, analysts may think like detectives, always asking the important questions; "Who? What? Where? When? Why? and How?" These questions help in determining the proper data sources to evaluate, which can greatly affect the type of analysis that can be performed.
Data identification
Data identification is the process of identifying the subsets of available data to focus on for analysis. The data by itself is useless unless it's interpreted, once we start analyzing the data it begins to become useful as it conveys a message. Any data that conveys a meaningful message becomes information. On a high level, unprocessed data takes the following forms to translate into exact message: noisy data; relevant and irrelevant data, filtered data; only relevant data, information; data that conveys a vague message, knowledge; data that conveys a precise message, wisdom; data that conveys exact message and reason behind it. To derive wisdom from an unprocessed data, we need to start processing it, refine the dataset by including data that we want to focus on, and organize data to identify information. In the context of social media analytics, data identification means "what" content are we interested in, in addition to the text of content, we want to know: who wrote the text? Where was it found or on which social media venue did it appear? Are we interested in information from a specific locale? When did someone say something in social media?
Attributes of data that need to be considered are as follows:
Data analysis
Data analysis is the set of activities that assist in transforming raw data into insight, which in turn leads to a new base of knowledge and business value. In other words, data analysis is the phase that takes filtered data as input and transforms that into information of value to the analysts. Many different types of analysis can be performed with social media data. The data analysis step begins once we know what problem we want to solve and know that we have sufficient data that is enough to generate a meaningful result. How can we know if we have enough evidence to warrant a conclusion? The answer to this question is; we don't know. We can't know this unless we start analyzing the data. While analyzing if we found the data isn't sufficient, reiterate the first phase and modify the question. If the data is believed to be sufficient for analysis, we need to build a data model.
Developing a data model is a process or method that we use to organize data elements and standardize how the individual data elements relate to each other. This step is important because we want to run a computer program over the data; we need a way to tell the computer which words or themes are important and if certain words relate to the topic we are exploring.
In the analysis of our data, it's handy to have several tools available at our disposal to gain a different perspective on discussions taking place around the topic. The aim here is to configure the tools to perform at peak for a particular task. For example, thinking about a word word cloud, if we take a large amount of data around computer professionals, say the "IT architect", and built a word cloud, no doubt the largest word in the could would be "architect". This analysis is also about tool usage. Some tools may do a good job at determining sentiment, where as others may do a better job at breaking down text into a grammatical form that enables us to better understand the meaning and use of various words or phrases. In performing analytic analysis, it is difficult to enumerate each and every step to take on an analytical journey. It is very much an iterative approach as there is no prescribed way of doing things.
The taxonomy and the insight derived from that analysis are as follows:
Information interpretation
Up to this phase, all the steps discussed were to analyze social media content. The important logical step-by-step discussion of what needs to be done in performing analysis; from posing a question, to gathering and cleaning data and then on to doing the analysis. The insights derived from analysis can be as varied as the original question that was posed in step one of analysis. At this stage, as the nontechnical business users are the receivers of the information, the form of presenting the data becomes important. How could the data make sense efficiently so it could be used in good decision making? Visualization (graphics) of the information is the answer to this question.
The best visualizations are ones that expose something new about the underlying patterns and relationships contain the data. Exposure of the patterns and understating them play a key role in decision making process. Mainly there are three criteria to consider in visualizing data.
Following are some of the common graphics that are used for visualization of information:
Role in business intelligence
Business intelligence (BI) can be described as "a set of techniques and tools for the acquisition and transformation of raw data into meaningful and useful information for business analysis purposes".
Sentiment Analyser is a technology framework in the field of Social Business Intelligence that leverages Informatica products. It is designed to reflect and suggest the focus shift of businesses from transactional data to behavioral analytics models. Sentiment Analyser frame work enables businesses to understand customer experience and ideates ways to enhance customer satisfaction.
Analytical tools
Some of the most commonly used Analytical tools are
Marketing
Social media creates new opportunities for companies that want to engage better with customers. Real engagement, which binds customers to companies, can drive revenue gains and reduce the costs associated with customer churn. However, engagement through social media requires new ways to manage and understand customer interactions.
social media marketing is like every other marketing campaign: It's a process that needs to be monitored and managed. The difference is that the social media marketing process is iterative and can change and adapt more quickly than traditional marketing campaigns. Being this adaptive requires platforms that help marketing professionals properly design, initiate, and manage social media marketing campaigns as well as perform the social media analytics that allow for deep customer understanding and monitoring for the effectiveness of these campaigns.
Social commerce
Social commerce is a subset of electronic commerce that employs collaborative social media tools to assist in online purchasing and selling.
Characteristics:
Methods
Impacts on business intelligence
Recent research on social media analytics has emphasized the need to adopt a BI based approach to collecting, analyzing and interpreting social media data (Heijnen et al., 2013; Murdough, 2009). Social media presents a promising, albeit challenging, source of data for business intelligence. Customers voluntarily discuss products and companies, giving a real-time pulse of brand sentiment and adoption. According to the recent research on social media analytics has mentioned that the need to adopt a Business Intelligence-based approach is needed for collecting, analyzing and interpreting social media data. Social media is one of the most important tools for marketers in the rapidly evolving media landscape. Firms have created specialized positions to handle their social media marketing. These arguments are in line with the literature on social media marketing that suggest that social media activities are interrelated and influence each other.