
 | ||
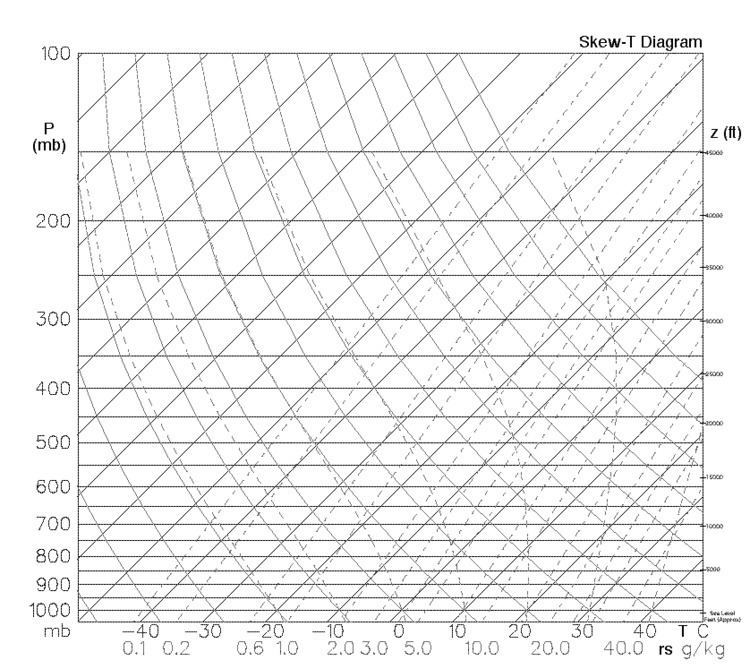
A Skew-T Log-P diagram is one of four thermodynamic diagrams commonly used in weather analysis and forecasting. In 1947, N. Herlofson proposed a modification to the emagram which allows straight, horizontal isobars, and provides for a large angle between isotherms and dry adiabats, similar to that in the tephigram. It was thus more suitable for some of the newer analysis techniques being invented by the United States Air Force.
The major use for skew-T log-P diagrams is the plotting of radiosonde soundings, which give a vertical profile of the temperature and dew point through the atmosphere above a certain point on the ground. The isopleths on the diagram can then be used to simplify many tedious calculations involved, which were previously performed by hand or not at all.