
 | ||
The service blueprint is a technique originally used for service design and innovation, but has also found applications in diagnosing problems with operational efficiency. The technique was first described by G. Lynn Shostack, a bank executive, in the Harvard Business Review in 1984. The service blueprint is an applied process chart which shows the service delivery process from the customer's perspective. The service blueprint has become one of the most widely used tools to manage service operations, service design and service positioning.
Contents
Blueprint Elements
A simple way to think about blueprints is as a process chart which consists of inputs, process and outputs.
A service blueprint is always constructed from the customer's perspective. A typical service blueprint identifies:
Optional inclusions - depending on intended application:
Blueprint: Evolution
The service blueprint has become one of the most useful tools in the services marketer's repertoire. Since its original development, a number of scholars have sought to increase its usefulness by adding various modifications that provide additional information and more demarcations. Zeithmal and Bitner recommend adding four lines to the map. (1) the Line of Visibility (as in the original); (2) the Line of Interaction which separates customer actions from service provider actions (3) the Line of Internal Interaction which separates the front office and the back office and (4) the Line of Implementation which separates management zone from the support zone. The addition of these lines helps to separate the functions of planning and controlling from support activities including preparation. Yet other scholars and practitioners have recommended adding different lines including (5) the Line of Order Penetration which separates customer-induced activities from customer-independent activities.
Lovelock, Patterson, and Walker (2001) suggest that the service blueprint may also be useful for specifying the level of variation from standards that would be tolerated at each step of the process without impacting on customer’s perceptions of quality and timeliness. Zeithaml, Bitner and Gremler (2006) also recommended adding bottlenecks and fail points to the map. A bottleneck is a point in the system at which consumers waiting time is likely to exceed average or minimum tolerable expectations. A fail point is any point within the encounter that has potential to affect customer satisfaction or quality. These additions increase the diagnostic value of the service blueprint.
Service blueprint: Applications
Service blueprinting has three main applications: simple representation; diagnosing operational deficiencies and service design (planning for structural change or new service development).
(1) Simple RepresentationA basic application for blueprints is as a simple form of representing or codifying what is actually occurring in the current operation. In visual form, the blueprint can be used in training programs, employee manuals to help clarify service processes. Blueprints may be used in market research as a means of helping respondents to visualise aspects of a service that may be the focus of an investigation. Blueprints can also be used in employee training programs and manuals to assist staff to visualise the service process and the relationships between steps in the process.(2) Diagnosing Operational DeficienciesBlueprints have also found widespread applications as diagnostic tools designed to uncover operational weaknesses. A number of scholars have championed the diagnostic value of blueprints.The blueprint can be analysed in terms of the appropriateness of physical evidence provided at each contact point as well as the suitability of contact personnel in relation to activities. In the event that any deficiencies are identified by the blueprinting process, management can develop operational standards for critical steps in the process.(3) Service design: Planning for Structural Change/ New Service DevelopmentShostack’s original intention was that blueprinting be used as a planning tool. Using a simple diagrammatic representation of the process, management could pose “What if?” type scenarios and reconfigure the service process in the blueprint form, without causing major disruptions in real time. For example, a planner might ask, What if we give employees wider latitude? What if we reduce latitude by scripting every step? What if we reduce complexity by combining two or more steps into a singe procedure? What if we add complexity by having different contact staff take responsibility for each step?Building a blueprint
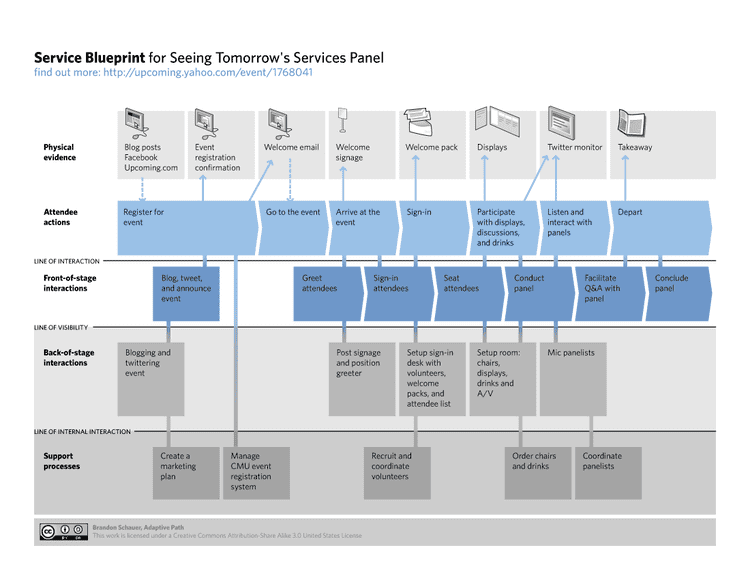
The original service blueprint is a highly visual, graphical map that delineates the key contact points in the service process and the nature of the contact – whether with physical evidence, personnel or procedures. It can be seen as a two dimensional map in which the horizontal axis represents time and the vertical axis represents the basic steps in the process. A line of visibility is included to separate actions visible to the customer from actions out of sight. Employee latitude, which refers to the amount of discretion given to employees to vary the service process, is shown on the map a call-out sign attached to the step. Process complexity is shown simply by the number of steps in the process.
The process of structuring a blueprint involves between five and seven steps, depending on the intended application. From the outset, the blueprint was designed to be seen from the customer’s perspective while simultaneously providing insights for management. Accordingly, the starting point should be to imagine the customer’s step-by-step contact points, indicating, where known, customer’s expectations in terms of minimum tolerable waiting times for each step.
Basic Service Blueprint
1. Identify activities, sequence of activities and linkages between activities. Activities include
(a) customer actions(b) front stage contact personnel actions(c) back stage contact personnel actions(d) support activities2. Identify line of visibility and add to blueprint.
3. Identify standards and tolerances, scripts, operating procedures, supporting services and inventory for each step and add to blueprint.
4. If required, draw additional lines such as line of physical interaction and line of IT interaction (optional, but recommended for complex services).
5. Specify timeframes. Show average timing or minimum tolerable customer expectations for each step and indicate responsible personnel.
Diagnostic Information (optional)
6. Identify and note fail points and excessive waits.
7. Manipulate divergence and complexity.
Traditionally, service blueprints have been depicted with lines and text boxes to depict anything from user actions to support processes. Fail points, bottlenecks and average time taken for each step can also be added at the analyst's discretion. The amount of information included in the service blueprint largely depends on how it is to be used. Over the years, a system of commonly accepted symbols associated with service blueprints has been developed. Although blueprints are not difficult to prepare, there is no universal agreement about how to present the finished process map.
Interpreting blueprints
When interpreting service blueprints, there are two basic considerations, complexity and divergence.
Complexity refers to the number and intricacy of the steps required to perform the service. A complex service process is one that has many steps.
Divergence refers to the degree of latitude, freedom, judgment, discretion, variability or situational adaptation permitted within any step of the process. The number of call-out signs attached to steps is an indicator of a service process that allows wide latitude to vary steps in the service delivery process.
Manipulations of the blueprint diagram might include increasing complexity, by adding more steps, or increasing divergence by allowing employees greater latitude in varying each step. In general, service processes that include high levels of employee discretion to vary steps to meet the needs of individual customers are moving towards customisation. On the other hand, reducing divergence, by standardising each step, often adds to complexity, but can result in a production-line approach to service process design. By manipulating complexity and divergence, it is possible to envisage four different positioning strategies:
Reduced Complexity: Specialisation strategyReduced Divergence: Volume-operationsIncrease Complexity: Product developmentIncreased Divergence: Niche market strategyManagerial actions for service design or structural change
The examination of service blueprints ‘may suggest opportunities for product improvement that might be achieved by reconfiguring delivery systems, adding or deleting specific elements, or repositioning the service to appeal to other segments.’ By manipulating complexity and divergence, it is possible to envisage service process improvements, service product improvements or new service innovations.
Reduce divergence: Reducing divergence typically requires substituting equipment for labour, involving customers in self-service and introducing standardised operating procedures. The outcome is uniformity which reduces costs and improves productivity. This approach usually involves a shift to high-volume/low margin positioning and requires access to mass markets to be successful. The vulnerability of this approach is that it reduces customisation and flexibility.
Increase divergence: Increasing divergence results is effectively a niche market strategy. Higher levels of customisation and flexibility require significant investments in human resources, recruitment and training all of which adds to costs. The approach usually involves a shift towards the prestige market segment and requires access to customers who are willing to pay a premium for customised services. The vulnerability of increased divergence is that processes are more difficult to manage, control and distribute.
Reduce complexity: Reduced complexity usually involves a specialisation strategy. As steps are removed from the process, the service firm concentrates on a narrower range of offerings. Examples include an obstetrician, radiologist. The advantage of this approach is that the service provider can develop high levels of expertise and that distribution and control are facilitated. The vulnerability of this approach is that it exposes the service firm to risk, especially if competitors continue to offer the convenience of full-service alternatives.
Increase complexity: Increased complexity is the service-product development option (i.e. sell different products to existing markets). Under this option, the service firm has an increased opportunity to maximise the revenue generated from each customer. The vulnerability inherent in this approach is that the firm’s market positioning may become confused. Managing a broader array of products may also expose the firm to risks of spreading its effort too thin to the detriment of overall service quality.
Managerial actions for improvements to operational efficiency
While blueprints draw attention to operational deficiencies, the blueprint, per se, cannot suggest solutions. In order to identify potential solutions to operating problems, the analyst must examine the service process and consider the factors that are likely to cause the problem. In addition, the range of possible solutions may be constrained by organisation’s mission, current market position and access to resources.
A very substantial body of marketing literature has addressed the question of possible solutions to problems identified through blueprinting. It is difficult to do justice to the wealth of studies using blueprints to gain managerial insights. A short summary of key managerial actions follows:
Standardize Procedures
Variable performance in service delivery is largely attributable to inseparability and human factors. Even in the back office, lack of standardisation can indirectly influence the customer process. In many organisations employees chose their own systems for storing files. Swank (2003: 125) cites an example of an insurance company where some employees filed according to policyholder (alphabetical), others by policy number (chronological) while others by date received. When employees were absent, substitutes sometimes found it hard to figure out where files were stored, so the process of retrieving files was delayed.
To reduce this variation, the service firm has several options.
Standardization is clearly designed to provide tighter control over service delivery with a view to improving consistency of quality and making it easier for management to assess processes. Other benefits include reductions in costs and improved productivity. However, it should be noted that gains in operational efficiency achieved through standardization usually involve sacrificing flexibility and customisation. For the analyst, there is a constant trade off between improved operational efficiency and customised delivery.
Identify and Manage Critical Incidents
Some deviation is a normal aspect of service interactions; however any deviation that is likely to affect the customer’s perceptions of value directly impacts on satisfaction. Those incidents which have the potential to become especially satisfying or dissatisfying are known as critical incidents and may benefit from standardised procedures. Customer waiting time is often considered to be a critical incident and may also need to have standards and tolerances developed.
Reduce the Number of Contact Points
It is often suggested that a reduction in the number of contact points in the service processes can lead to greater efficiency since it reduces the total number of points where failure can creep into the system. To simplify the delivery process, the most common way is to delegate activities to the customer through self-service technologies or self-guided processes. However, replacing technologies for humans contributes to inflexibility of service processes and may ultimately lead to fewer opportunities to differentiate a service offering in the marketplace. Planners may need to balance competing interests of controlling the process with the overall positioning strategy.
Increase customer participation
Customer participation should not be confused with customer contact. Customer participation is the degree of effort and involvement, both mental and physical, required to produce and deliver the service. Examples of services high in customer participation include do-it-yourself car washes, salad bars and buffets, and distance (off-campus) education services.
The level of customer participation varies from providing simple information to the service provider, to joint-production with the assistance of service staff, to instances where the customer is the sole producer (i.e. self-service). Customer participation focuses on reducing the costs associated with delivering the service product. For example, it costs approximately $3 for a bank to serve a customer over-the-counter as opposed to 1c via the Internet. Although the additional ‘work’ customers have to perform may be associated with such benefits as extended service hours, time-savings and in some instances monetary savings, these benefits may not be immediately obvious—they must be promoted.
Segregate Complexity
Anyone who has stood in line at a bank while a single teller assisted a customer with a lengthy transaction understands this principle. One solution is to cluster tasks with similar levels of difficulty into separate groups with their own procedures and performance. For example, a bank branches with large numbers of retail customers (with relatively simple transactions) and commercial customers (making large deposits and withdrawals) might want to introduce separate teller windows for each group of customers.
Place Linked Processes in Close Physical Proximity
Complex services involve many steps and may require paperwork or customer files to be shuffled between contact staff, back office and support departments. The time taken to move paperwork or customers is very costly in terms of time and efficiency. Tertiary student enrolment provides a great example of complex processes that are often not very customer-friendly. Students must firstly see an academic advisor to ensure that their course progress in on track, then see an administrative advisor to check that paperwork is in order and finally see a cashier to pay tuition fees and pay any fines, such as overdue library books before they can finalise their enrolment. In many institutions, this enrolment process can take half a day – and requires students to run from pillar to post as they complete each step. Locating each stage in close proximity has many advantages. Not only does it improve operational efficiency, it has the potential to allow service staff to focus on the total process and gain a better understanding of the ways that their actions impact on other parts of the system. In short, it forces employees to focus not just on the activities for which they are directly responsible.
Eliminate Loop-Backs
A loopback is a manufacturing term that refers to a situation where work returns to a previous step for further processing. Loop-backs typically create delays because they cause consequential problems along the production line. Given that service processes involved humans, rather than machines, processing may be complicated by employees' choices concerning which tasks to undertake and how to schedule them. If loop-backs present a problem, management can assist employees to clarify roles and tasks by focusing on their place within the overall service process.
Control Fail Points
Failures in service process may be attributed to either the service provider or the customer. It is possible that the service provider did not utilise resources in a way that best serves the customers needs. Alternatively, service provider failures may be caused by mismanagement. For example, an employee, who chooses to deviate from the script, may fail to serve the customer correctly. Finally, failures can be caused by customers who do not understand the process and do not know what they should be doing. For example, a customer might fail to provide appropriate documents to an appointment with a bank manager or lawyer.
It is important to spend time diagnosing the reasons for fail points before implementing solutions. Failures attributable to customers are often due to misinformation. In such cases, the service firm could, for instance, provide customers with information checklists at the time when they make an appointment. Failures due to lack of resources may require short-term solutions to alleviate the immediate problem while long-term solutions including resource acquisition can be pursued.