
 | ||
A saturation dome is a graphical representation of the combination of vapor and gas that is used in thermodynamics. It can be used to find either the pressure or the specific volume as long as one already has at least one of these properties.
Contents
Description
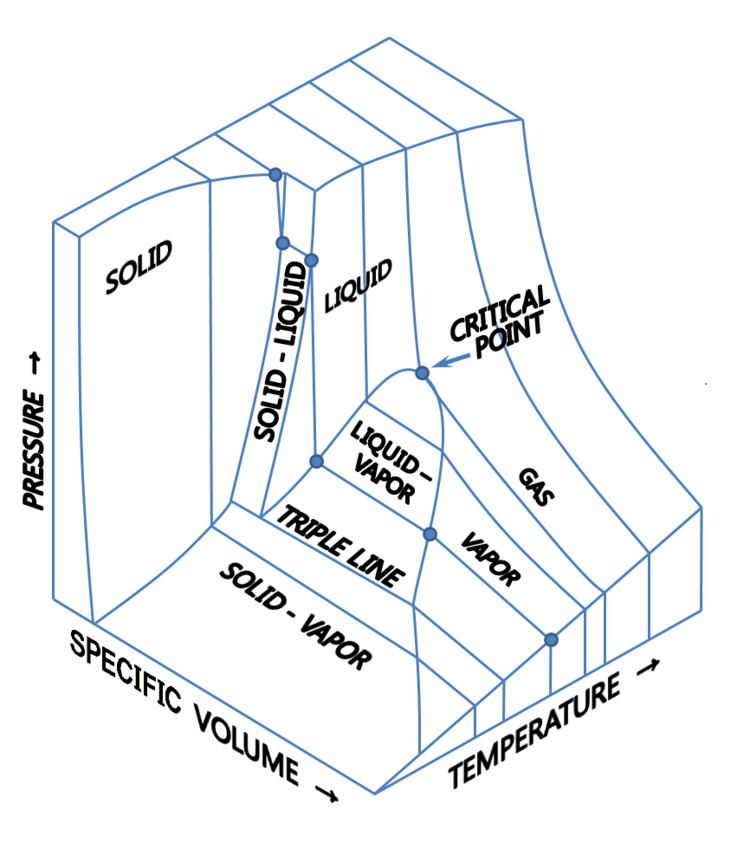
A saturation dome uses the projection of a P–v–T diagram (pressure, specific volume, and temperature) onto the P–v plane. This gives a P–v diagram at a constant temperature. The points that create the left-hand side of the dome represent the saturated liquid states, while the points on the right-hand side represent the saturated vapor states (commonly referred to as the “dry” region). On the left-hand side of the dome there is compressed liquid and on the right-hand side there is superheated gas.
Within the dome itself, there is a liquid–vapor mixture. This two-phase region is commonly referred to as the “wet” region. The percentage of liquid and vapor can be calculated using vapor quality. The triple state line is where the three phases (pressure, specific volume, and temperature) exist in equilibrium.
Critical point
The point at the very top of the dome is called the critical point. This point is where the saturated liquid and saturated vapor lines meet. Past this point, it is impossible for a liquid–vapor transformation to occur. It is also where the critical temperature and critical pressure meet. Beyond this point, it is also impossible to distinguish between the liquid and vapor phases.
States
A saturation state is the point where a phase change begins or ends. For example, the saturated liquid line represents the point where any further addition of energy will cause a small portion of the liquid to convert to vapor. Likewise, along the saturated vapor line, any removal of energy will cause some of the vapor to condense back into a liquid, producing a mixture. When a substance reaches the saturated liquid line it is commonly said to be at its boiling point. The temperature will remain constant while it is at constant pressure underneath the saturation dome (boiling water stays at a constant of 212F) until it reaches the saturated vapor line. This line is where the mixture has converted completely to vapor. Further heating of the saturated vapor will result in a superheated vapor state. This is because the vapor will be at a temperature higher than the saturation temperature (212F for water) for a given pressure.
Vapor quality
Vapor quality refers to the vapor–liquid mixture that is contained underneath the dome. This quality is defined as the fraction of the total mixture which is vapor, based on mass. A fully saturated vapor has a quality of 100% while a saturated liquid has a quality of 0%. Quality can be estimated graphically as it is related to the specific volume, or how far horizontally across the dome the point exists. At the saturated liquid state, the specific volume is denoted as vf, while at the saturated vapor stage it is denoted as vg.
Quality can be calculated by the equation: