
 | ||
The temperature of the atmosphere at various altitudes as well as sea and land surface temperatures can be inferred from satellite measurements. These measurements can be used to locate weather fronts, monitor the El Niño-Southern Oscillation, determine the strength of tropical cyclones, study urban heat islands and monitor the global climate. Wildfires, volcanos, and industrial hot spots can also be found via thermal imaging from weather satellites.
Contents
- Measurements
- Surface measurements
- Tropospheric and stratospheric measurements
- Trends from the record
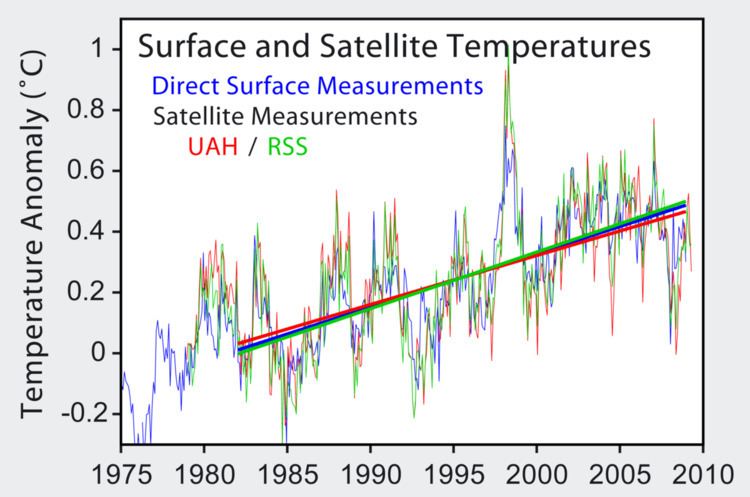
- Comparison to instrumental record
- Reconciliation with climate models
- Historic differences
- References
Weather satellites do not measure temperature directly. They measure radiances in various wavelength bands. Since 1978 microwave sounding units (MSUs) on National Oceanic and Atmospheric Administration polar orbiting satellites have measured the intensity of upwelling microwave radiation from atmospheric oxygen, which is related to the temperature of broad vertical layers of the atmosphere. Measurements of infrared radiation pertaining to sea surface temperature have been collected since 1967.
Satellite datasets show that over the past four decades the troposphere has warmed and the stratosphere has cooled. Both of these trends are consistent with the influence of increasing atmospheric concentrations of greenhouse gases.
Measurements
Satellites do not measure temperature. They measure radiances in various wavelength bands, which must then be mathematically inverted to obtain indirect inferences of temperature. The resulting temperature profiles depend on details of the methods that are used to obtain temperatures from radiances. As a result, different groups that have analyzed the satellite data have produced differing temperature datasets. Among these are the UAH dataset prepared at the University of Alabama in Huntsville and the RSS dataset prepared by Remote Sensing Systems.
The satellite time series is not homogeneous. It is constructed from a series of satellites with similar but not identical sensors. The sensors also deteriorate over time, and corrections are necessary for orbital drift and decay. Particularly large differences between reconstructed temperature series occur at the few times when there is little temporal overlap between successive satellites, making intercalibration difficult.
Surface measurements
Satellites may also be used to retrieve surface temperatures in cloud-free conditions, generally via measurement of thermal infrared from AVHRR. Weather satellites have been available to infer sea surface temperature (SST) information since 1967, with the first global composites occurring during 1970. Since 1982, satellites have been increasingly utilized to measure SST and have allowed its spatial and temporal variation to be viewed more fully. For example, changes in SST monitored via satellite have been used to document the progression of the El Niño-Southern Oscillation since the 1970s. Over the land the retrieval of temperature from radiances is harder, because of the inhomogeneities in the surface. Studies have been conducted on the urban heat island effect via satellite imagery. Use of advanced very high resolution infrared satellite imagery can be used, in the absence of cloudiness, to detect density discontinuities (weather fronts) such as cold fronts at ground level. Using the Dvorak technique, infrared satellite imagery can be used to determine the temperature difference between the eye and the cloud top temperature of the central dense overcast of mature tropical cyclones to estimate their maximum sustained winds and their minimum central pressures. Along Track Scanning Radiometers aboard weather satellites are able to detect wildfires, which show up at night as pixels with a greater temperature than 308 K (95 °F). The Moderate-Resolution Imaging Spectroradiometer aboard the Terra satellite can detect thermal hot spots associated with wildfires, volcanoes, and industrial hot spots.
Tropospheric and stratospheric measurements
From 1979 to 2005 the microwave sounding units (MSUs) and since 1998 the Advanced Microwave Sounding Units on NOAA polar orbiting satellites have measured the intensity of upwelling microwave radiation from atmospheric oxygen. The intensity is proportional to the temperature of broad vertical layers of the atmosphere, as demonstrated by theory and direct comparisons with atmospheric temperatures from radiosonde (balloon) profiles. Upwelling radiance is measured at different frequencies; these different frequency bands sample a different weighted range of the atmosphere. The brightness temperature (TB) measured by satellite is given by:
where
Both the surface and atmospheric weights are dependent on the surface emissivity
where
The atmospheric weighting functions
The first term in this equation is related to the radiation emitted upward from the level
MSU Channel 1 is not used to monitor atmospheric temperature because it's too much sensitive to the emission from the surface, furthermore it is heavily contaminated by water vapor/liquid water in the lowermost troposphere.
Channel 2 or TMT is broadly representative of the troposphere, albeit with a significant overlap with the lower stratosphere (the weighting function has its maximum at 350 hPa and half-power at about 40 and 800 hPa). In an attempt to remove the stratospheric influence, Spencer and Christy developed the synthetic "2LT or TLT" product by subtracting signals at different view angles; this has a maximum at about 650 hPa. However, this amplifies noise, increases inter-satellite calibration biases and enhances surface contamination. The 2LT product has gone through numerous versions as various corrections have been applied.
Another methodology to reduce the influence of the stratosphere has been developed by Fu and Johanson, the TTT(Total Troposphere Temperature) channel is a linear combination of the TMT and TLS channel: TTT=1.156*TMT-0.153*TLS for the global average and TTT=1.12*TMT-0.11*TLS at tropical latitudes.
The T4 or TLS channel in representative of the temperature in the lower stratosphere with a peak weighting function at around 17 km above the earth surface.
Since 1979 the Stratospheric sounding units (SSUs) on the NOAA operational satellites provided near global stratospheric temperature data above the lower stratosphere. The SSU is a far-infrared spectrometer employing a pressure modulation technique to make measurement in three channels in the 15 μm carbon dioxide absorption band. The three channels use the same frequency but different carbon dioxide cell pressure, the corresponding weighting functions peaks at 29 km for channel1, 37 km for channel2 and 45 km for channel3.
Trends from the record
Records have been created by merging data from nine different MSUs, each with peculiarities (e.g., time drift of the spacecraft relative to the local solar time) that must be calculated and removed because they can have substantial impacts on the resulting trend.
The process of constructing a temperature record from a radiance record is difficult. The satellite temperature record comes from a succession of different satellites and problems with inter-calibration between the satellites are important, especially NOAA-9, which accounts for most of the difference between various analyses. NOAA-11 played a significant role in a 2005 study by Mears et al. identifying an error in the diurnal correction that leads to the 40% jump in Spencer and Christy's trend from version 5.1 to 5.2. There are ongoing efforts to resolve differences in satellite temperature datasets.
Christy et al. (2007) find that the tropical temperature trends from radiosondes matches closest with his v5.2 UAH dataset. Furthermore, they assert there is a growing discrepancy between RSS and sonde trends beginning in 1992, when the NOAA-12 satellite was launched. This research found that the tropics were warming, from the balloon data, +0.09 (corrected to UAH) or +0.12 (corrected to RSS) or 0.05 K (from UAH MSU; ±0.07 K room for error) a decade.
Using the T2 or TMT channel (which include significant contributions from the stratosphere, which has cooled), Mears et al. of Remote Sensing Systems (RSS) find (through January 2017) a trend of +0.140 °C/decade. Spencer and Christy of the University of Alabama in Huntsville (UAH), find a smaller trend of +0.08 °C/decade.
A no longer updated analysis of Vinnikov and Grody found +0.20 °C per decade (1978–2005). Another satellite temperature analysis is provided by NOAA/NESDIS STAR Center for Satellite Application and Research and use simultaneous nadir overpasses (SNO) to remove satellite intercalibration biases yielding more accurate temperature trends. The STAR-NOAA analysis finds a 1979-2016 trend of +0.129 °C/decade for TMT channel.
Lower stratospheric cooling is mainly caused by the effects of ozone depletion with a possible contribution from increased stratospheric water vapor and greenhouse gases increase. There is a decline in stratospheric temperatures, interspersed by warmings related to volcanic eruptions. Global Warming theory suggests that the stratosphere should cool while the troposphere warms
The long term cooling in the lower stratosphere occurred in two downward steps in temperature both after the transient warming related to explosive volcanic eruptions of El Chichón and Mount Pinatubo, this behavior of the global stratospheric temperature has been attributed to global ozone concentration variation in the two years following volcanic eruptions.
Since 1996 the trend is slightly positive due to ozone recovery juxtaposed to a cooling trend of 0.1K/decade that is consistent with the predicted impact of increased greenhouse gases.
The process of deriving trends from SSUs measurement has proved particularly difficult because of satellites drift, inter-calibration between different satellite with scant overlap and gas leak in the instrument carbon dioxide pressure cell, furthermore since the radiances measured by SSUs are due to emission by carbon dioxide the weighting functions move to higher altitudes as the carbon dioxide concentration in the stratosphere increase. Mid to upper stratosphere temperature show strong negative trend interspersed by transient volcanic warming after the explosive volcanic eruptions of El Chichón and Mount Pinatubo, little temperature trend has been observed since 1995. The greatest cooling occurred in the tropical stratosphere consistent with enhanced Brewer-Dobson circulation under greenhouse gas concentrations increase.
Comparison to instrumental record
The satellite records have the advantage of global coverage, whereas the radiosonde record is longer. There have been complaints of data problems with both records.
To compare to the trend from the surface temperature record (+0.161±0.033 °C/decade from 1979 to 2012 according to NASA GISS) it is most appropriate to derive trends for the part of the atmosphere nearest the surface, i.e., the lower troposphere. Doing this, through January 2017:
An alternative adjustment to remove the stratospheric contamination has been introduced by Fu et al. (2004), after the correction the vertical weighting function is nearly the same of the T2(TMT) channel in the troposphere, the University of Washington analysis finds 1979-2012 trends of +0.13 °C/decade when applied to the RSS data set and +0.10 °C/decade when applied to the UAH data set.
The IPCC fifth assessment report concluded: " based on multiple independent analyses of measurements from radiosondes and satellite sensors it is virtually certain that globally the troposphere has warmed and the stratosphere has cooled since the mid-20th century. Despite unanimous agreement on the sign of the trends, substantial disagreement exists among available estimates as to the rate of temperature changes, particularly outside the NH extratropical troposphere, which has been well sampled by radiosondes.
Reconciliation with climate models
Surface temperature data showed substantial global average warming, while early versions of satellite and radiosonde data showed little or no warming above the surface. While the satellite data now show global warming, there is still a significant difference between what Climate models predict and what the satellite data show for warming of the lower troposphere with the climate models predicting significantly more warming than what the satellites measure. The climate models also overpredict the results of the radiosonde measurements.
The most recent climate model simulations give a range of results for changes in global average temperature. Some models show more warming in the troposphere than at the surface, while a slightly smaller number of simulations show the opposite behavior. There is no fundamental inconsistency among these model results and observations at the global scale, with the trends now being similar.
Globally, the troposphere is predicted by models to warm about 1.2 times more than the surface; in the tropics, the troposphere should warm about 1.5 times more than the surface. Most climate models used by the IPCC in preparation of their third assessment show a slightly greater warming at the TLT level than at the surface (0.03 °C/decade difference) for 1979-1999 while the GISS trend is +0.161 °C/decade for 1979 to 2012, the lower troposphere trends calculated from satellite data by UAH and RSS are +0.12 °C/decade and +0.135 °C/decade.
This greater global average warming in the troposphere compared to the surface (present in the models but not observed data) is most marked in the tropics.
"In the tropics, surface temperature changes are amplified in the free troposphere. Models and observations show similar amplification behavior for monthly and interannual temperature variations, but not for decadal temperature changes. Tropospheric amplification of surface temperature anomalies is due to the release of latent heat by moist, rising air in regions experiencing convection."
Although all the datasets show the expected tropospheric amplification at seasonal and annual timescales it is still debated whether or not the long term trends are consistent with the expected moist adiabatic lapse rate amplification due to difficulty of producing homogenized datasets, some satellite temperature reconstruction are consistent with the expected amplification while others are not.
The IPCC fifth assessment report concluded "Although there have been substantial methodological debates about the calculation of trends and their uncertainty, a 95% confidence interval of around ±0.1°C per decade has been obtained consistently for both LT and MT (e.g., Section 2.4.4; McKitrick et al., 2010). In summary, despite unanimous agreement on the sign of the observed trends, there exists substantial disagreement between available estimates as to the rate of temperature changes in the tropical troposphere, and there is only low confidence in the rate of change and its vertical structure."
Historic differences
For some time the only available satellite record was the UAH version, which (with early versions of the processing algorithm) showed a global cooling trend for its first decade. Since then, a longer record and a number of corrections to the processing have revised this picture: the UAH dataset has shown an overall warming trend since 1998, though less than the RSS version. In 2001, an extensive comparison and discussion of trends from different data sources and periods was given in the Third Assessment Report of the Intergovernmental Panel on Climate Change (IPCC) (section 2.2.4).