
Legislature House of Commons First contested 1979 District webpage profile, map Province Ontario | District created 1976 Last contested 2013 Population (2011) 106,293 Elector 80,029 | |
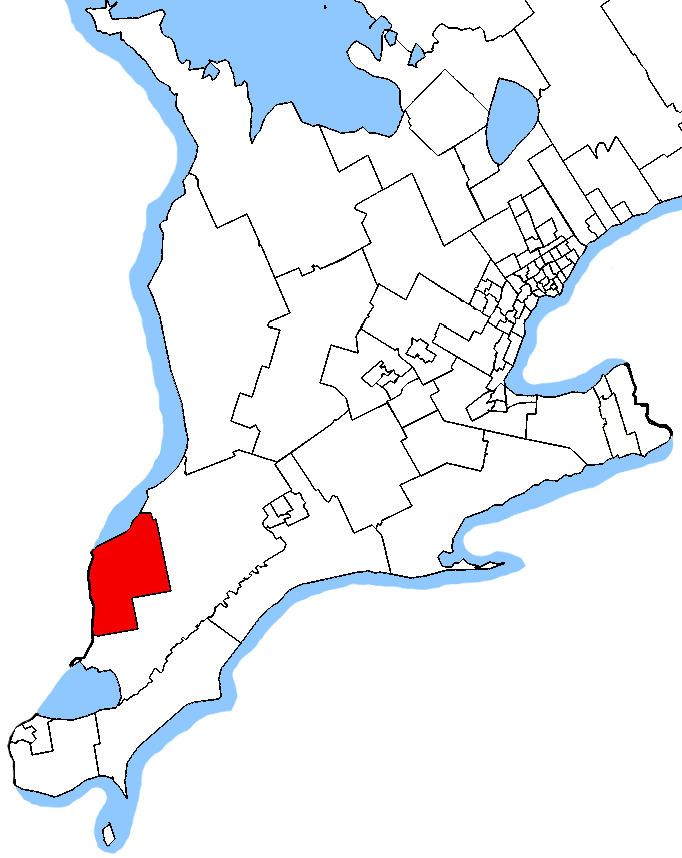 | ||
Census divisions Lambton County, Sarnia, St. Clair, Ontario, Plympton-Wyoming, Petrolia, Enniskillen, Ontario, Point Edward | ||
Sarnia—Lambton (formerly known as Sarnia) is a federal electoral district in Ontario, Canada, that has been represented in the Canadian House of Commons since 1968. It is located in the area of the city of Sarnia, in the southwest corner of the province of Ontario.
Contents
Until 2015, Sarnia—Lambton, with its predecessors Sarnia, and Lambton West, was Canada's most bellwetherly riding, having voted for the winning party from 1963 to 2011.
History
It was created as Sarnia electoral district in 1966 from parts of Lambton West riding. It consisted of that part of the County of Lambton contained in the City of Sarnia and the Townships of Moore, Sarnia and Plympton excepting the Town of Forest.
In 1970, the name of the electoral district was changed to Sarnia—Lambton.
It was abolished in 1976 when it was redistributed between Lambton—Middlesex and a new Sarnia riding. The new Sarnia riding consisted of that part of the County of Lambton contained in the City of Sarnia, the Townships of Moore and Sarnia, the Village of Point Edward, and Indian Reserve No. 45.
The name of this electoral district was changed in 1981 to Sarnia—Lambton again.
In 1996, the riding was redefined to exclude the township of Sarnia and include the township of Sombra.
In 2003, it was redefined to consist of that part of the County of Lambton comprising the City of Sarnia, the towns of Petrolia and Plympton-Wyoming, the villages of Oil Springs and Point Edward, the townships of Enniskillen and St. Clair, and Sarnia Indian Reserve No. 45.
This riding was left unchanged after the 2012 electoral redistribution.
Demographics
According to the Canada 2011 Census; 2013 representationEthnic groups: 93.4% White, 3.0% Aboriginal, 1.1% South Asian
Languages: 97.3% English
Religions: 70.3% Christian (27.3% Catholic, 14.2% United Church, 7.2% Anglican, 4.5% Presbyterian, 3.3% Baptist, 1.7% Pentecostal, 1.0% Lutheran, 11.0% Other), 27.7% No religion
Median income (2010): $30,245
Average income (2010): $41,900
Sarnia—Lambton
Note: Conservative vote is compared to the total of the Canadian Alliance vote and Progressive Conservative vote in 2000 election.
Note: Canadian Alliance vote is compared to the Reform vote in 1997 election.