
 | ||
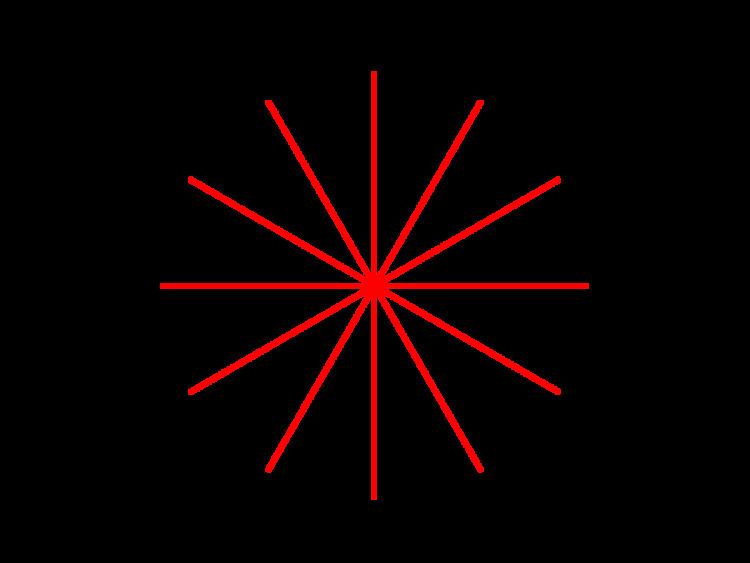
The electric axis of the heart is the net direction in which the wave of depolarisation travels. It is measured using an electrocardiogram (ECG). Normally, this begins at the atrioventricular node (AV node); from here the wave of depolarisation travels down to the apex of the heart. The hexaxial reference system can be used to visualise the directions in which the depolarisation wave may travel.
Contents
- Signs symptoms and risk factors
- Fascicular block
- Lateral myocardial infarction
- Right ventricular hypertrophy
- Pre excitation syndromes
- Ventricular tachycardia
- Ventricular ectopy
- Pathophysiology
- Left ventricular atrophy
- Conduction abnormalities
- Position of heart in the chest
- Diagnosis
- References
On a hexaxial diagram (see figure 1):
RAD is an ECG finding that arises either as an anatomically normal variant or an indicator of underlying pathology.
Signs, symptoms and risk factors
There are often no symptoms for RAD and it is usually found by chance during an ECG. Many of the symptoms exhibited by patients with RAD are associated with its different causes. The table below displays the four most common causes and the signs, symptoms and risk factors associated with it.
Fascicular block
Blockage of the left posterior fascicle would lead to activation of the anterior portion of the left ventricle followed by activation of the rest of the ventricle in a superior to inferior direction and directed towards the right. This would lead to right axis deviation findings on an ECG. Bifascicular block is a combination of right bundle branch block and either left anterior fascicular block or left posterior fascicular block. Conduction to the ventricle would therefore be via the remaining fascicle. The ECG will show typical features of RBBB plus either left or right axis deviation.
Lateral myocardial infarction
The lateral wall of the left ventricle is supplied by branches of the left anterior descending (LAD) and left circumflex (LCx) arteries. Infarction of the lateral wall will thus lead to deviation of the axis away from the site of infarction.
Right ventricular hypertrophy
Increased thickness of the right ventricle leads to right axis deviation (see above).
Pre-excitation syndromes
Pre-excitation refers to early activation of the ventricles due to impulses bypassing the AV node via an accessory pathway. Accessory pathways are abnormal conduction pathways formed during cardiac development. An example of pre-excitation syndromes is Wolff Parkinson White syndrome. Here, the presence of a left lateral accessory pathway leads to right-axis deviation.
Ventricular tachycardia
Fascicular tachycardia usually arises from the posterior fascicle of the left bundle branch. They produce QRS complexes of relatively short durations with a right bundle branch block pattern. Tachycardias originating in the anterior left fascicle would lead to right axis deviation.
Right ventricular outflow tract tachycardia originates from the outflow tract of the right ventricle or the tricuspid annulus. As it arises from the right ventricle, the impulse spreads inferiorly from beneath the pulmonary valve, and there right axis deviation.
Ventricular ectopy
Ventricular ectopy is when the heartbeat is an abnormal heartbeat where the QRS complex is significantly wider. When the origin of the ectopic heartbeat is in the anterior fascicule then there is right axis deviation.
Pathophysiology
The pathophysiology depends on the specific cause of right axis deviation. Most causes can be attributed to one of four main mechanisms. These include right ventricular hypertrophy, reduced muscle mass of left ventricle, altered conduction pathways and change in the position of the heart in the chest.
Right ventricular hypertrophy
Enlargement of right ventricular myocardial mass can result in right axis deviation. There are 2 main reasons for this mechanism. Firstly, more muscle mass will result in greater amplitude of depolarisation of that side of the heart. Secondly, depolarisation of the heart will be slower through the right ventricle relative to the left, and therefore the effects of the right ventricle on the axis of the heart will be dominant.
Left ventricular atrophy
Decrease in myocardial mass of the left ventricle will shift the balance of depolarisation towards the right. For example, scarring and atrophy caused by ischaemia of the left ventricle will cause depolarisation of the left side of the heart to be less forceful. Hence, depolarisation of the right ventricle will be greater in amplitude than left, shifting the axis to the right.
Conduction abnormalities
Changes in the conduction pathways of the heart can result in right axis deviation. For example, an accessory pathway from the left atrium to the left ventricle, as in Wolff-Parkinson-White Syndrome, will result in the left ventricle finishing depolarisation earlier than the right. Hence, the right ventricle will have more of an effect on the axis of the heart.
Position of heart in the chest
The apex of the heart is normally orientated towards the left. A more vertical orientation of the heart, shifts the axis to the right. Physiologically, this can occur in tall and thin individuals. Pathologically, conditions such as a left-sided pneumothorax and lung hyperinflation (e.g. COPD) can cause rightwards displacement of the heart. The congenital condition of dextrocardia results in right axis deviation.
Diagnosis
In general, a positive (upwards) deflection of an ECG trace demonstrates an electrical activity which moves towards the measuring electrode, whereas a negative (downwards) deflection of an ECG trace demonstrates an electrical activity which moves away from the measuring electrode. The electrical heart axis can be estimated from the ECG by using the quadrant method or degree method.
- Quadrant Method: Leads I and II are usually observed. If lead I is positive (translating to 0° on the hexaxial reference system) and lead II is positive (translating to 60°), the electrical heart axis is estimated to fall in the left lower quadrant within the normal range. On the other hand, as shown in Figure 2, if lead I is negative (translating to 180°) and lead II is positive, the electrical heart axis is estimated to fall in the right lower quadrant suggesting a right axis deviation. Similarly, leads I and aVF can be used.
- Degree method: First, identify the lead with the smallest QRS complex or isoelectric (flat) QRS complex (lead a). After locating the axis of the lead on the hexaxial reference system, identify the lead which is perpendicular to it (lead b). If lead b is positive, the electrical heart axis can be estimated to lie within the quadrant between axis of lead a and lead b.
A simple tool to quickly identify axis deviation (Figure 3) is the popular mnemonic; Reaching for Right Axis Deviation and Leaving for Left Axis Deviation. This refers to the appearance of leads I and III. If the QRS complex is negative in lead I and positive in lead III, the QRS complexes appear to be "reaching" to touch each other. This signifies right axis deviation. Conversely, if the QRS complex is positive in lead I and negative in lead III. the leads have the appearance of "leaving" each other. If the QRS complex in lead II is also negative, this confirms a left axis deviation.