
 | ||
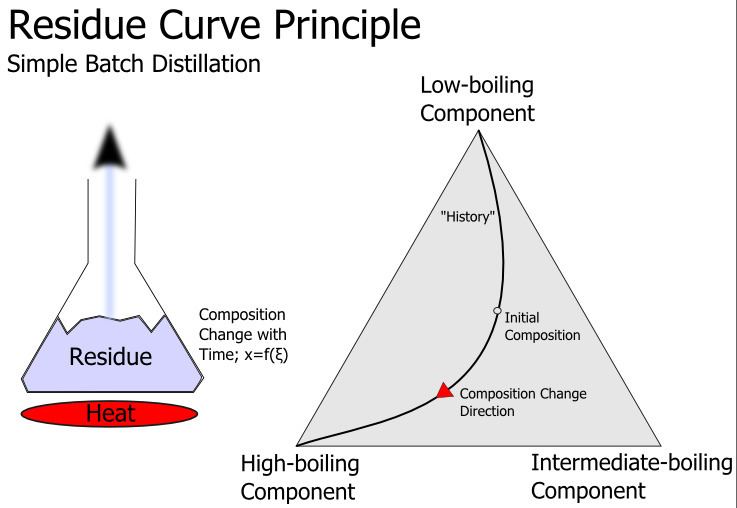
A residue curve describes the change of the composition of the liquid phase of a chemical mixture during continuous evaporation at the condition of vapor–liquid equilibrium (open distillation). Multiple residue curves for a single system are called residue curves map.
Contents
Residue curves allow testing the feasibility of a separation of mixtures and therefore are a valuable tool in designing distillation processes. Residue curve maps are typically used for examining ternary mixtures which can't be easily separated by distillation because of azeotropic points or too small relative volatilities.
Characteristics
- Residue curves start at the composition of a feed and then move to pure components or azeotropic points with higher temperatures (isobaric condition) or lower vapor pressures (isothermal condition). This happens because more of the light boiling substances are vaporized than of the high boiling substances and therefore the concentration of the high boilers increase in the liquid phase. A residue curve can also be constructed backwards and then moves to the azeotropic point or pure component with lower temperatures or higher vapor pressure.
- Azeotropic points can create so called distillation regions separated by border lines from other regions. If the composition of a feed lies inside a specific region a residue curve cannot cross a border line and stays in its initial region. This means for a distillation tower that it is not possible to obtain pure components at the bottom and the head of the column. At least at one outlet an azeotropic mixture is obtained.
- The same conclusion is valid for the pure components. If they are in different distillation regions mixtures of these pure components can't be separated by simple distillation.
Definitions
Pure components and azeotropic points are called nodes. Three different types are possible:
- Stable node: This is the pure component or the azeotropic point with the highest boiling temperature and lowest vapor pressure in a distillation region. All residue curves end at stable nodes.
- Unstable node: This is the pure component or the azeotropic point with the lowest boiling temperature and highest vapor pressure in a distillation region. Residue curve never reach an unstable node.
- Saddle: These are pure components or azeotropic points with an intermediate boiling temperature and vapor pressure in a distillation region. Residue curves move toward and then away from saddles but saddles are never end points. Only border lines start or end at saddles.
The distillation regions and the nodes are the topology of the mixture.
Calculation
The calculation of residue curves is done by solving the mass balance over time by numerical integration with methods like Runge-Kutta.
with
x: vector of liquid compositions in mole fractions [mol/mol]
y: vector of vapor compositions in mole fractions [mol/mol]
ξ: dimensionless time
The integration of this equation can be done forward and backward in time allowing the calculation from any feed composition to the begin and end of the residue curve.
Example
The ternary mixture of chloroform, methanol and acetone has three binary azeotropes and one ternary azeotrope. Together with the three pure components the system has seven nodes which altogether form four distallation regions. Two nodes are stable (pure methanol and the binary azeotrope of chloroform and acetone which have both the lowest vapor pressure (isothermal calculation) in their two regions where they are part of. The other two binary azeotropes are unstable nodes. They have the highest vapor pressure in their regions.
The other nodes are saddles (the ternary azeotrope, the pure acetone and the pure chloroform).
The border lines in this system connect the ternary azeotrope (saddle) with the two stable nodes and the two unstable nodes.
The residue curves are always moving away from an unstable node to a saddle but never reaches that because they then turn to a stable node.