
 | ||
In statistics, a ranklet is an orientation-selective non-parametric feature which is based on the computation of Mann–Whitney–Wilcoxon (MWW) rank-sum test statistics. Ranklets achieve similar response to Haar wavelets as they share the same pattern of orientation-selectivity, multi-scale nature and a suitable notion of completeness.
Contents
Rank-based (non-parametric) features have become popular in the field of image processing for their robustness in detecting outliers and invariance to monotonic transformations such as brightness, contrast changes and gamma correction.
The MWW is a combination of Wilcoxon rank-sum test and Mann–Whitney U-test. It is a non-parametric alternative to the t-test used to test the hypothesis for the comparison of two independent distributions. It assesses whether two samples of observations, usually referred as Treatment T and Control C, come from the same distribution but do not have to be normally distributed.
The Wilcoxon rank-sum statistics Ws is determined as:
Subsequently, let MW be the Mann–Whitney statistics defined by:
where m is the number of Treatment values.
A ranklet R is defined as the normalization of MW in the range [−1, +1]:
where a positive value means that the Treatment region is brighter than the Control region, and a negative value otherwise.
Example
Suppose
Hence, in the above example the Control region was a little bit brighter than the Treatment region.
Method
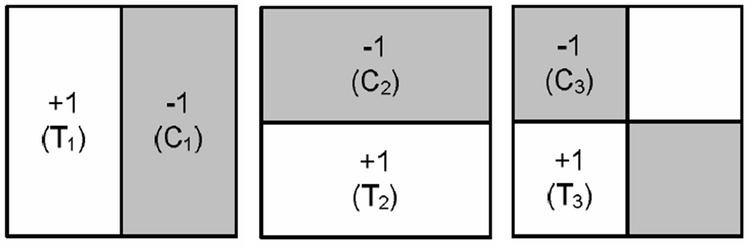
Since Ranklets are non-linear filters, they can only be applied in the spatial domain. Filtering with Ranklets involves dividing an image window W into Treatment and Control regions as shown in the image below:
Subsequently, Wilcoxon rank-sum test statistics are computed in order to determine the intensity variations among conveniently chosen regions (according to the required orientation) of the samples in W. The intensity values of both regions are then replaced by the respective ranking scores. These ranking scores determine a pairwise comparison between the T and C regions. This means that a ranklet essentially counts the number of TxC pairs which are brighter in the T set. Hence a positive value means that the Treatment values are brighter than the Control values, and vice versa.