
 | ||
The racial achievement gap in the United States refers to the educational disparities between various ethnic groups. It manifests itself in a variety of ways: among students, blacks and Hispanics are more likely to receive lower grades, score lower on standardized tests, drop out of high school, and they are less likely to enter and complete college than whites, who similarly score lower than Asians. The evidence, antecedents, implications, and successes of the achievement gap are discussed below.
Contents
- Evidence of the racial achievement gaps
- Kindergarten through fifth grade
- Third through eighth grade
- Secondary school
- Standardized test scores
- Mathematics
- Reading
- High school dropout rates
- High school completion rates
- SAT scores
- College enrollment and graduation rates
- Long term trends
- Theories about the origin of the racial achievement gap
- Family structureparenting style
- Cultural differences
- Geographic and neighborhood factors
- History
- Genetic differences
- Economic outcomes
- Job opportunities
- Stereotype threat
- Political representation
- Special programs
- Efforts to narrow the achievement gap
- Early childhood education
- Standards based reform
- Goals 2000
- No Child Left Behind
- Institutional changes
- Charter schools
- Private schools
- Teach For America
- References
Evidence of the racial achievement gaps
Over the past 45 years, students in the United States have made notable gains in academic achievement. However, the racial achievement gap remains because not all groups of students are advancing at the same rates. Evidence of the racial achievement gap has been manifested through standardized test scores, high school dropout rates, high school completion rates, college acceptance and retention rates, as well as through longitudinal trends. While efforts to close the racial achievement gap have increased over the years with varying success, studies have shown that disparities still exist between achievement levels of minorities compared to White counterparts.
Kindergarten through fifth grade
The racial achievement gap has been found to exist before students enter kindergarten for their first year of schooling. At the start of kindergarten, Hispanic and black students have math and reading scores substantially lower than those of white students. While both Hispanics and blacks scores have significantly lower test scores than their white counterparts, Hispanic and black have scores that are roughly equal to each other. In a study published in 2009, Reardon and Galindo (2009) specifically examine test scores by race and ethnicity. The data Reardon and Galindo (2009) use comes from the ECLS-K, sponsored by the National Center for Education Statistics. The ECLS-K contains data on a nationally representative sample of approximately 21,400 students from the kindergarten class of 1998–1999. Students in the sample were assessed in reading and mathematics skills six times from 1998 to 2004. The content areas of the tests are based on the National Assessment of Educational Progress (NAEP) fourth-grade content areas, adapted to be age appropriate at each grade level. The assessments were scored using a three-parameter Item Response Theory (IRT) model. Reardon and Galindo (2009) found that average Hispanic and black students begin kindergarten with math scores three quarters of a standard deviation lower than those of white students and with reading scores a half standard deviation lower than those of white students. Six years later, Hispanic-white gaps narrow by roughly a third, whereas black-white gaps widen by about a third. More specifically, the Hispanic-white gap is a half standard deviation in math, and three-eighths in reading at the end of fifth grade. The trends in the Hispanic-white gaps are especially interesting because of the rapid narrowing that occurs between kindergarten and first grade. Specifically, the estimated math gap declines from 0.77 to 0.56 standard deviations, and the estimated reading gap from 0.52 to 0.29 in the roughly 18 months between the fall of kindergarten and the spring of first grade. In the four years from the spring of first grade through the spring of fifth grade, the Hispanic-white gaps narrow slightly to 0.50 standard deviations in math and widening slightly to 0.38 deviations in reading.
Third through eighth grade
In a 2006 study published in the Review of Economics and Statistics, Clotfelter (2006) examines test scores of elementary and middle school students by race. The data used in the study comes from administrative records created by North Carolina's Department of Public Instruction and maintained by the North Carolina Education Research Data Center and are not nationally representative. North Carolina requires all students to take standardized achievement tests in both math and reading at the end of every grade between grades 3 and 8. In order to make comparisons across years, Clotfelter (2006) normalized the scaled scores for each test in every year over all students in the state who took the test so that each test would have a mean score of 0 and a standard deviation of 1. On this normalized scale, positive scores denote above-average performances relative to the statewide average, and negative scores denote below-average performance. Analysis by Clotfelter (2006) found gaps between four different racial groups: whites, Asians, Hispanics, and blacks. Essentially, while the black-white gaps are substantial, both Hispanic and Asian students tend to gain on whites as they progress in school. The white-black achievement gap in math scores is about half a standard deviation, and the white-black achievement gap in reading is a little less than half a standard deviation. By fifth grade, Hispanic and white students have roughly the same math and reading scores. By eighth grade, scores for Hispanic students in North Carolina surpassed those of observationally equivalent whites by roughly a tenth of a standard deviation. Asian students surpass whites on math and reading tests in all years except third and fourth grade reading.
Secondary school
In a 2006 study, LoGerfo, Nichols, and Reardon (2006) found that, starting in the eighth grade, white students have an initial advantage in reading achievement over black and Hispanic students but not Asian students. Using nationally representative data from by the National Center for Education Statistics (NCES)—the Early Childhood Longitudinal Study (ECLS-K) and the National Education Longitudinal Study (NELS:88), LoGerfo, Nichols, and Reardon (2006) claim that black students score 5.49 points lower than white students and Hispanic students score 4.83 points lower than white students on reading tests. These differences in initial status are compounded by differences in reading gains made during high school. Specifically, between ninth and tenth grades, white students gain slightly more than black students and Hispanic students, but white students gain less than Asian students. Between tenth and twelfth grades, white students gain at a slightly faster rate than black students, but white students gain at a slower rate than Hispanic students and Asian students.
In eighth grade, white students also have an initial advantage over black and Hispanic students in math tests. However, Asian students have an initial 2.71 point advantage over white students and keep pace with white students throughout high school. Between eighth and tenth grade, black students and Hispanic students make slower gains in math than white students, and black students fall farthest behind. Asian students gain 2.71 points more than white students between eight and tenth grade. Some of these differences in gains persist later in high school. For example, between tenth and twelfth grades, white students gain more than black students, and Asian students gain more than white students. There are no significant differences in math gains between white students and Hispanic students. By the end of high school, gaps between groups increase slightly. Specifically, the initial 9-point advantage of white students over black students increases by about a point, and the initial advantage of Asian students over white students also increases by about a point. Essentially, by the end of high school, Asian students are beginning to learn intermediate-level math concepts, whereas black and Hispanic students are far behind, learning fractions and decimals, which are math concepts that the white and Asian students learned in the eighth grade. Black and Hispanic students end twelfth grade with scores 11 and 7 points behind those of white students, while the male-female difference in math scores is only around 2 points.
Standardized test scores
The racial group differences across admissions tests, such as the SAT, ACT, GRE, GMAT, MCAT, LSAT, Advanced Placement Program examinations and other measures of educational achievement, have been fairly consistent. Since the 1960s, the population of students taking these assessments has become increasingly diverse. Consequently, the examination of ethnic score differences have been more rigorous. Specifically, the largest gaps exist between white and African American students. On average, they score about .82 to 1.18 standard deviations lower than white students in composite test scores. Following closely behind is the gap between white and Hispanic students. Asian American students performance were comparable to those of White students except Asian American students performed one quarter standard deviation unit lower on the SAT verbal section, and about one half a standard deviation unit higher in the GRE Quantitative test.
The National Assessment of Educational Progress reports the national Black-White gap and the Hispanic-White Gap in math and reading assessments, measured at the 4th and 8th grade level. The trends show both gaps widen in mathematics as students grow older, but tend to stay the same in reading. Furthermore, the NAEP measures the widening and narrowing of achievement gaps on a state level. From 2007 to 2009, the achievement gaps for the majority of states stayed the same, although more fluctuations were seen at the 8th grade level than the 4th grade level.
The Black-White Gap demonstrates:
The Hispanic White Gap demonstrates:
The National Educational Longitudinal Survey (NELS, 1988) demonstrates similar findings in their evaluation of assessments administered to 12th graders in reading and math.
Mathematics
Results of the mathematics achievement test:
White-African American gap
Non Hispanic White-Hispanic gap
Reading
Results of the reading achievement test:
Non Hispanic White-Hispanic gap
High school dropout rates
According to the US Department of Education, event dropout rate is the percentage of high school students who dropped out of high school between the beginning of one school year and the beginning of the next school year. Five out of every 100 students enrolled in high school in October 2000 left school before October 2001 without successfully completing a high school program. The percentage of students who were event dropouts decreased from 1972 through 1987. However, despite some year-to-year fluctuations, the percentage of students dropping out of school each year has stayed relatively the same since 1987. Data from the October 2001 Current Population Survey (CPS) show that black and Hispanic students were more likely to have dropped out of high school between October 2000 and October 2001 than were white or Asians/Pacific Islander students. During this period, 6.3% of black and 8.8% of Hispanic high school students dropped out compared to 4.1% of white and 2.3% of Asian/Pacific Islander high school students.
According to the US Department of Education, status dropout rates measure the percentage of individuals who are not enrolled in high school and who lack a high school credential, independent of when they dropped out. Status rates are higher than event rates because they include all dropouts in this age range, regardless of when they last attended school or whether or not they ever entered the US education system. In October 2001, about 3.8 million 16- through 24-year-olds were not enrolled in a high school program and had not completed high school. These individuals accounted for 10.7% of the 35.2 million 16- through 24-year-olds in the United States in 2001. In 1972, the white status dropout rate was 40% and the black status dropout rate was 49%. Because the black rate declined more steeply than the white rate, there has been a narrowing of the gap between the dropout rates for blacks and whites. However, this narrowing occurred in the 1980s, and the gap between whites and blacks has remained fairly constant since 1990. The percentage of Hispanics who were status dropouts has remained higher than that of blacks and whites in every year since 1970. Even though Hispanics represented approximately the same percentage of the young adult population as did blacks, Hispanics were disproportionately represented among status dropouts in 2001. Also in 2001, the status dropout rate for Asians/Pacific Islanders ages 16–24 was lower than for any other 16- through 24-year-olds. Specifically, the status rate for Asians/Pacific Islanders was 3.6%, compared with 27.0% for Hispanics, 10.9% for blacks, and 7.3% for whites.
High school completion rates
Status completion rates measure the percentage of a given population that has a high school credential, regardless of when the credential was earned. In 2001, 86.5% of 18- through 24-year-olds not enrolled in elementary or secondary school had completed high school. Status completion rates increased from 82.8% in 1972 to 85.6% in 1990. Since 1991, the rate has shown no consistent trend and has fluctuated between 84.8% and 86.5%. High school status completion rates for white and black young adults increased between the early 1970s and 1990 but has remained relatively the same since 1990. Specifically, status completion rates for white students increased from 86.0% in 1972 to 89.6% in 1990. Since 1990, white completion rates have remained in the range of 89.4–91.8%. In 2001, 91.0% of white and 85.6% of black 18- through 24-year-olds had completed high school. The percentage of black students completing high school rose from 72.1% in 1972 to 85.6% in 2001. The gap between black and white completion rates narrowed between 1972 and 2001. In 2001, 65.7% of all Hispanic 18- through 24-year- olds completed high school. This percentage compares to 91.0% of whites, 85.6% of blacks, and 96.1% of Asians/Pacific Islanders. Essentially, in 2001, whites and Asians/Pacific Islanders were more likely than their black and Hispanic peers to have completed high school. Also, whites completed high school at a higher rate than both blacks and Hispanic students. Black students completed high school at a higher rate than Hispanics.
The four-year completion rate is the percentage of 9th-grade students who left school over a subsequent 4-year period while also completing a high school credential. Data for the 4-year completion rate calculations are taken from the Common Core of Data (CCD). The 4-year completion rate calculation is dependent on the availability of dropout estimates over a 4-year span, and current counts of completers. Because dropout rate information was missing for many states during the 4-year period considered by the US Department of Education, 4- year completion rate estimates for the 2000-01 school year are only available for 39 states. Since data were not available from all states, an overall national rate could not be calculated. However, among reporting states, the high school 4-year completion rates for public school students ranged from a high of 90.1% in North Dakota to a low of 65.0% in Louisiana.
SAT scores
Racial and ethnic variations in SAT scores follow a similar pattern to other racial achievement gaps. In 1990, the average SAT was 491 for whites, 528 for Asians, 385 for blacks, and 429 for Mexican Americans. 34% of Asians compared with 20% of whites, 3% of blacks, 7% of Mexican Americans, and 9% of Native Americans scored above a 600 on the SAT math section. On the SAT verbal section in 1990, whites scored an average of 442, compared with 410 for Asians, 352 for blacks, 380 for Mexican Americans, and 388 for Native Americans. 8% of whites, 10% of Asians, 2% of blacks, 3% of Mexican Americans, and 3% of Native Americans scored above 600 on the SAT verbal section in 1990.
College enrollment and graduation rates
The US Department in Education demonstrates performance of different ethnic groups in colleges and universities. Specifically, they found that about 72% of White students who have completed high school enrolled in college the same year, compared to 44% for Black students, and 50% for Hispanic students. Furthermore, trends in undergraduate and graduate enrollment have shown increases in all ethnicity groups, but the largest gap still exists for Black student enrollment. Hispanic and Asian/Pacific Islanders student enrollment have experienced the most growth since 1976. The 6-year national college graduation rate is 59% for White students, 51% for Hispanic students, 46% for Black females, and 35% for Black males. Furthermore, even at prestigious institutions, the graduation rate of white students is higher than that of black student.
Long-term trends
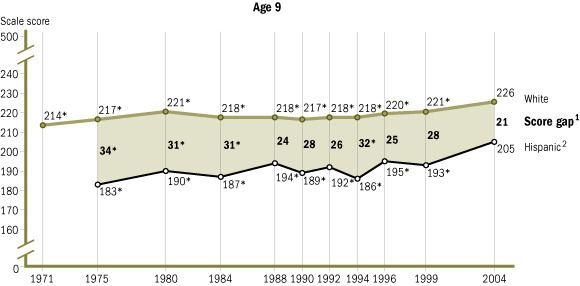
The National Assessment of Educational Progress (NAEP) has been testing seventeen-year-olds since 1971. From 1971 to 1996, the black-white reading gap shrank by almost one half and the math gap by almost one third. Specifically, blacks scored an average of 239 points, and whites scored an average of 291 points on the NAEP reading tests in 1971. In 1990, blacks scored an average of 267, and whites scored an average of 297 points. On NAEP math tests in 1973, blacks scored an average of 270, and whites scored 310. In 1990, black average score was 289 and whites scored an average of 310 points. For Hispanics, the average NAEP math score for seventeen-year-olds in 1973 was 277 and 310 for whites. In 1990, the average score among Hispanics was 284 compared with 310 for whites.
Because of small population size in the 1970s, similar trend data are not available for Asian Americans. Data from the 1990 NAEP Mathematics Assessment Tests show that among twelfth graders, Asians scored an average of 315 points compared with 301 points for whites, 270 for blacks, 278 for Hispanics, and 290 for Native Americans. Racial and ethnic differentiation is most apparent at the highest achievement levels. Specifically, 13% of Asians performed at level of 350 points or higher, 6% of whites, less than 1% of blacks, and 1% of Hispanics did so.
The NAEP has since collected and analyzed data through 2008. Overall, the White-Hispanic and the White-Black gap for NAEP scores have significantly decreased since the 1970s. The Black-White Gap demonstrates:
The Hispanic-White Gap demonstrates:
Furthermore, subgroups showed predominant gains in 4th grade at all achievement levels. In terms of achieving proficiency, gaps between subgroups in most states have narrowed across grade levels, yet had widened in 23% of instances. The progress made in elementary and middle schools was greater than that in high schools, which demonstrates the importance of early childhood education. Greater gains were seen in lower-performing subgroups rather than in higher-performing subgroups. Similarly, greater gains were seen in Latino and African American subgroups than for low-income and Native American subgroups.
Theories about the origin of the racial achievement gap
The achievement gap between low-income minority students and middle-income White students has been a popular research topic among sociologists since the publication of the report, "Equality of Educational Opportunity" (more widely known as the Coleman Report). This report was commissioned by the U.S. Department of Education in 1966 to investigate whether the performance of African-American students was caused by their attending schools of a lesser quality than white students. The report suggested that both in-school factors and home/community factors affect the academic achievement of students and contribute to the achievement gap that exists between races.
The study of the achievement gap can be addressed from two standpoints—from a supply-side and a demand-side viewpoint of education. In Poor Economics, Banerjee and Duflo explain the two families of arguments surrounding education of underserved populations. Demand-side arguments focus on aspects of minority populations that influence education achievement. These include family background and culture, which shape perceptions and expectations surrounding education. A large body of research has been dedicated to studying these factors contributing to the achievement gap. Supply-side arguments focus on the provision of education and resources and the systemic structures in place that perpetuate the achievement gap. These include neighborhoods, funding, and policy. In 2006, Ladson-Billings called on education researchers to move the spotlight of education research from family background to take into account the rest of the factors that affect educational achievement, as explained by the Coleman Report. The concept of opportunity gaps—rather than achievement gaps—has changed the paradigm of education research to assess education from a top-down approach.
Family structure/parenting style
Children can differ in their readiness to learn before they enter school. Research has shown that parental involvement in a child's development has a significant effect on the educational achievement of minority children. According to sociologist Annette Lareau, differences in parenting styles can affect a child's future achievement. In her book Unequal Childhoods, she argues that there are two main types of parenting: concerted cultivation and the achievement of natural growth.
The parenting practices that a child is raised with influences their future educational achievement. However, parenting styles are heavily influenced by the parents' and family's social, economic, and physical circumstances. In particular, immigration status (if applicable), education level, incomes, and occupations influence the degree of parental involvement their children's academic achievement. These factors directly determine the access of the parents to time and resources to dedicate to their children's development. These factors also indirectly determine the home environment and parents' educational expectations of their children. For example, children from poor families have lower academic performance in kindergarten than children from middle to upper-class backgrounds, but children from poor families who had cognitively stimulating materials in the home demonstrated higher rates of academic achievement in kindergarten. Additionally, parents of children living in poverty are less likely to have cognitively stimulating materials in the home for their children and are less likely to be involved in their child's school.
In the United States, most minority groups are more likely to live in poverty than White Americans. Unemployment rate and mortgages for African and Latin Americans are usually higher than White Americans'. And although Asian American families earn, on average, more income than White American families do, there are usually more family members working in the Asian American family than the White American family. These disparities in socioeconomic status between minority groups and White Americans help explain differences in parenting styles, family structure, and the resultant educational achievement of minority children. However, the racial gaps persists when comparing families with similar income. Whites from families with incomes below $10,000 had a mean SAT test score that was 61 points higher than blacks whose families had incomes of between $80,000 and $100,000
African-American family structure
In 2011, 72% of Black babies were born to unwed mothers.
There is consensus in the literature about the negative consequences of growing up in single-parent homes on educational attainment and success. Children growing up in single-parent homes are more likely to not finish school and generally obtain less years of schooling than those in two-parent homes. Specifically, boys growing in homes with only their mothers are more likely to receive poorer grades and display behavioral problems.
For black high school students, the African American family structure does affect their educational goals and expectations also. Studies on the topic have indicated that children growing up in single-parent homes faces disturbances in young childhood, adolescence and young adulthood as well. Although these effects are sometimes minimal and contradictory, it is generally agreed that the family structure a child grows up in is important for their success in the educational sphere.
Cultural differences
Some experts believe that cultural factors contribute to the racial achievement gap. Students from minority cultures face language barriers, differences in cultural norms in interactions, learning styles, varying levels of receptiveness of their culture to White American culture, and varying levels of acceptance of the White American culture by the students. In particular, it has been found that minority students from cultures with views that generally do not align with the mainstream cultural views have a harder time in school. Furthermore, views of the value of education differ by minority groups as well as members within each group. Both Hispanic and African-American youths often receive mixed messages about the importance of education, and often end up performing below their academic potential.
Latino American
Many Hispanic parents who immigrate to The United States see a high school diploma as being a sufficient amount of schooling and may not stress the importance of continuing on to college. Parental discouragement from pursuing higher education tends to be based on the notion of "we made it without formal schooling, so you can too". Additionally, depending on the immigration generation and economic status of the student, some students prioritize their obligations to assisting their family over their educational aspirations. Poor economic circumstances place greater pressure on the students to sacrifice time spent working towards educational attainment in order to dedicate more time to help support the family. Surveys have shown that while Latino American families would like their children to have a formal education, they also place high value on getting jobs, marrying, and having children as early as possible, all of which conflict with the goal of educational achievement. However, counselors and teachers usually promote continuing on to college. This message conflicts with the one being sent to Hispanic students by their families and can negatively affect the motivation of Hispanic students, as evidenced by the fact that Latinos have the lowest college attendance rates of any racial/ethnic group. Overall, Latino American students face barriers such as financial stability and insufficient support for higher education within their families. Reading to children when they are younger increases literacy comprehension, which is a fundamental concept in the education system; however, it is less likely to occur within Latino American families because many parents do not have any formal education. Currently, Latino Americans over the age of 25 have the lowest percentage in obtaining a bachelor's degree or higher amongst all other racial groups; while only having 11 percent.
African American
African American students are also likely to receive different messages about the importance of education from their peer group and from their parents. Many young African-Americans are told by their parents to concentrate on school and do well academically, which is similar to the message that many middle-class white students receive. However, the peers of African-American students are more likely to place less emphasis on education, sometimes accusing studious African-American students of "acting white." This causes problems for black students who want to pursue higher levels of education, forcing some to hide their study or homework habits from their peers and perform below their academic potential.
Asian American
Asian American students are more likely to view education as a means to social mobility, as they believe it provides a means to overcome language barriers as well as discrimination. This notion comes from parental expectations of their children, which are rooted in the cultural belief that hard work is the key to educational and eventually occupational attainment. Many Asian Americans immigrated to the United States voluntarily, in search for better opportunities. This immigration status comes into play when assessing the cultural views of Asian Americans since attitudes of more recent immigration are associated with optimistic views about the correlation between hard work and success. Obstacles such as language barriers and acceptance of White American culture are more easily overcome by voluntary immigrants since their expectations of attaining better opportunities in the United States influence their interactions and experiences.
Geographic and neighborhood factors
The quality of school that a student attends and the socioeconomic status of the student's residential neighborhood are two factors that can affect a student's academic performance.
In the United States, the financing of most public schools is based on local property taxes This system means that schools located in areas with lower real estate values have proportionately less money to spend per pupil than schools located in areas with higher real estate values. This system has also maintained a "funding segregation:" because minority students are much more likely to live in a neighborhood with lower property values, they are much more likely to attend a school that receives significantly lower funding.
Using property taxes to fund public schools contributes to school inequality. Lower-funded schools are more likely to have (1) lower-paid teachers; (2) higher student-teacher ratios, meaning less individual attention for each student; (3) older books; (4) fewer extracurricular activities, which have been shown to increase academic achievement; (5) poorly maintained school buildings and grounds; and (6) less access to services like school nursing and social workers. All of these factors can affect student performance and perpetuate inequalities between students of different races.
Living in a high-poverty or disadvantaged neighborhood have been shown to negatively influence educational aspirations and consequently attainment. The Moving to Opportunity experiment showed that moving to a low-poverty neighborhood had a positive effect on the educational attainment of minority adolescents. The school characteristics associated with the low-poverty neighborhoods proved to be effective mediators, since low-poverty neighborhoods tended to have more favorable school composition, safety, and quality. Additionally, living in a neighborhood with economic and social inequalities leads to negative attitudes and more problematic behavior due to and social tensions. Greater college aspirations have been correlated with more social cohesiveness among neighborhood youth, since community support from both youth and adults in the neighborhood tends to have a positive influence on educational aspirations.
Racial and ethnic residential segregation in the United States still persists, with African Americans experiencing the highest degree of residential segregation, followed by Latino Americans and Asian Americans and Pacific Islanders. This isolation from White American communities is highly correlated with low property values and high-poverty neighborhoods. This issue is propagated by issues of home ownership facing minorities, especially African Americans and Latino Americans, since residential areas predominantly populated by these minority groups are perceived as less attractive in the housing market. Home ownership by minority groups is further undermined by institutionalized discriminatory practices, such as differential treatment of African Americans and Latino Americans in the housing market compared with White Americans. Higher mortgages charged to African American or Latino American buyers make it more difficult for members of these minority groups to attain full home ownership and accumulate wealth. As a result, African American and Latino American groups continue to live in racially segregated neighborhoods and face the socioeconomic consequences of residential segregation.
Differences in the academic performance of African-American and White students exist even in schools that are desegregated and diverse, and studies have shown that a school's racial mix does not seem to have much effect on changes in reading scores after sixth grade, or on math scores at any age In fact, minority students in segregated-minority schools have more optimism and greater educational aspirations as well as achievements than minority students in segregated-white schools. This can be attributed to various factors, including the attitudes of faculty and staff at segregated-white schools and the effect of stereotype threat.
History
The minority status of a student plays a major role in the minority experience of schooling. Non-White minority groups are classified into voluntary and involuntary minority groups, which are differentiated by the reasons that brought the groups to the United States. Voluntary minorities are immigrants who came to the United States for better social, economic, and political opportunities, such as the Chinese and Punjabi Indians. Optimism regarding educational and occupational prospects are reflected in parents' expectations of their children. It should be noted, however, that earlier generations of students from voluntary minority groups tend to perform better and place a higher value on education than native-born and later-generation students of the same group. Involuntary minorities are those from groups who came to the United States or integrated into the United States against their will, such as Native Americans or African Americans. Involuntary minority groups face both external and internal tensions; institutionalized socioeconomic factors prevent social mobility for these groups, in addition to the identity-related conflicts within a minority culture. These ethnic histories thus define the social status of minority groups and thereby influence the schooling experience of minority students.
Legacy of discrimination argument
An argument has been put that the disparity in income that exists between African Americans and Whites directly contributes to the racial achievement gap. This school of thought argues that the origin of this "wealth gap" is the slavery and racism that made it extremely difficult for African-Americans to accumulate wealth for almost 100 years. A comparable history of discrimination created a similar gap between Hispanics and whites. This results in many minority children being born into low socioeconomic backgrounds, which in turn affects educational opportunities.
Research has shown time and again that the wealth and income of parents is a primary factor influencing student achievement. A low socioeconomic background can have negative effects on a child's educational achievement before even starting school; indeed, research has shown that the achievement gap is present between races before starting formal education. On average, when entering kindergarten, African-American students are one year behind White students in terms of vocabulary and basic math skills, and this gap continues to grow as a child's education continues.
Refugees
Part of the racial achievement gap can be attributed to the experience of the refugee population in the United States. Refugee groups in particular face obstacles such as cultural and language barriers and discrimination, in addition to premigration stresses. These factors affect how successfully refugee children can assimilate to and succeed in the United States. Furthermore, it has been shown that immigrant children from politically unstable countries do not perform as well as immigrant children from politically stable countries.
Genetic differences
J. Philippe Rushton and Arthur Jensen suggested that the results of intelligence testing demonstrate that genetic differences can explain some or all of the racial achievement gap in American education. Research has demonstrated that African-Americans' average brain sizes are about 6.3% smaller than Whites and 7.7% smaller than Asians. Studies have also shown that Blacks adopted at birth but raised by middle-class White American parents, on average, had adult IQ scores 18% lower than Whites and Asians raised by White parents.
Robert Sternberg later published a reply to Rushton and Jensen in which he wrote critically of their approach to the subject and of some of their specific claims and rhetoric. Sternberg states his belief that science should be conducted with values in mind. He then argues that Rushton and Jensen were wrong to suggest any policy implications of their research because international variation in social norms and definitions of success may affect the influence IQ has on the attainment of success. While Sternberg acknowledges that there is a genetic factor affecting individual intelligence, he asserts that intelligence is changeable, and at the group level, subjective.
Economic outcomes
The racial achievement gap has consequences on the life outcomes of minority students. However, this gap also has the potential for negative implications for American society as a whole, especially in terms of workforce quality and the competitiveness of the American economy. As the economy has become more globalized and the United States' economy has shifted away from manufacturing and towards a knowledge-based economy; education has become an increasingly important determinate of economic success and prosperity. A strong education is now essential for preparing and training the future workforce that is able to compete in the global economy. Education is also important for attaining jobs and a stable career, which is critical for breaking the cycle of poverty and securing a sound economic future, both individually and as a nation. Students with lower achievement are more likely to drop out of high school, entering the workforce with minimal training and skills, and subsequently earning substantially less than those with more education. Therefore, eliminating the racial achievement gap and improving the achievement of minority students will help eliminate economic disparities and ensure that America's future workforce is well prepared to be productive and competitive citizens.
Reducing the racial achievement gap is especially important because the United States is becoming an increasingly diverse country. The percentage of African-American and Hispanic students in school is increasing: in 1970, African-Americans and Hispanics made up 15% of the school-age population, and that number had increased to 30% by 2000. It is expected that minority students will represent the majority of school enrollments by 2015. Minorities make up a growing share of America's future workforce; therefore, the United States' economic competitiveness depends heavily on closing the racial achievement gap.
The racial achievement gap affects the volume and quality of human capital, which is also reflected through calculations of GDP. The cost of racial achievement gap accounts for 2–4 percent of the 2008 GDP. This percentage is likely to increase as blacks and Hispanics continue to comprise a higher proportion of the population and workforce. Furthermore, it was estimated that $310 billion would be added to the US economy by 2020 if minority students graduated at the same rate as white students. Even more substantial is the narrowing of educational achievement levels in the US compared to those of higher-achieving nations, such as Finland and Korea. McKinsey & Company estimate a $1.3 trillion to $2.3 trillion, or a 9 to 16 percent difference in GDP. Furthermore, if high school dropouts were to cut in half, over $45 billion would be added in savings and additional revenue. In a single high school class, halving the dropout rate would be able to support over 54,000 new jobs, and increase GDP by as much as $9.6 billion. Overall, the cost of high school drop outs on the US economy is roughly $355 billion.
$3.7 billion would be saved on community college remediation costs and lost earnings if all high school students were ready for college. Furthermore, if high school graduation rates for males raised by 5 percent, cutting back on crime spending and increasing earnings each year would lead to an $8 billion increase the US economy.
Job opportunities
As the United States' economy has moved towards a globalized knowledge-based economy, education has become even more important for attaining jobs and a stable career, which is critical for breaking the cycle of poverty and securing a sound economic future. The racial achievement gap can hinder job attainment and social mobility for minority students. The United States Census Bureau reported $62,545 as the median income of White families, $38,409 of Black families, and $39,730 for Hispanic families. And while the median income of Asian families is $75,027, the number of people working in these households is usually greater than that in White American families. The difference in income levels relate highly to educational opportunities between various groups. Students who drop out of high school as a result of the racial achievement gap demonstrate difficulty in the job market. The median income of young adults who do not finish high school is about $21,000, compared to the $30,000 of those who have at least earned a high school credential. This translates into a difference of $630,000 in the course of a lifetime. Students who are not accepted or decide not to attend college as a result of the racial achievement gap may forgo over $450,000 in lifetime earnings had they earned a Bachelor of Arts degree. In 2009, $36,000 was the median income for those with an associate degree was, $45,000 for those with a bachelor's degree, $60,000 for those with a master's degree or higher.
Stereotype threat
Beyond differences in earnings, minority students also experience stereotype threat that negatively affects performance through activation of salient racial stereotypes. The stereotype threat both perpetuates and is caused by the achievement gap. Furthermore, students of low academic performance demonstrate low expectations for themselves and self-handicapping tendencies. Psychologists Claude Steele, Joshua Aronson, and Steven Spencer, have found that Microaggression such as passing reminders that someone belongs to one group or another (i.e.: a group stereotyped as inferior in academics) can affect test performance.
Steele, Aronson and Spencer, have examined and performed experiments to see how stereotypes can threaten how students evaluate themselves, which then alters academic identity and intellectual performance. Steele tested the stereotype threat theory by giving Black and White college students a half-hour test using difficult questions from the verbal Graduate Record Examination (GRE). In the stereotype-threat condition, they told students the test diagnosed intellectual ability. In saying that the test diagnoses intellectual ability it can potentially elicit the stereotype that Blacks are less intelligent than Whites. In the no-stereotype-threat condition, they told students that the test was a problem-solving lab task that said nothing about ability. This made stereotypes irrelevant. In the stereotype threat condition, Blacks who were evenly matched with Whites in their group by SAT scores, performed worse compared to their White counterparts. In the experiments with no stereotype threat, Blacks performed slightly better than in those with a stereotype threat, though still significantly worse than whites. Aronson believes the study of stereotype threat offers some "exciting and encouraging answers to these old questions [of achievement gaps] by looking at the psychology of stigma -- the way human beings respond to negative stereotypes about their racial or gender group". When pressed, Steele, Aronson, and Spenser, acknowledge that their experiments on stereotype threat only explain a modest portion of test-score gaps. However, their findings have consistently been erroneously attributed to explaining the entirety of the test score gap. The American Psychological Association is one such institution that that misuses the study to posit that stereotype threat undercuts the tendency of evolutionary psychologists to lay the blame on genetic and cultural factors, such as whether African Americans "value" education. Researchers from Heterodox Academy, a think tank dedicated to pursuing intellectual diversity in academia, posit that the tendency of some social scientists to over emphasise the potency of stereotype threat, has to do with their loyalty to politically correct clean slate ideology, rather than objective reasoning. Adherence to such dogma therefore permits these individuals to dismiss the possibility of less palatable explanations for racial group disparities, such as genetics and culture.
Political representation
Another consequence of the racial achievement gap can be seen in the lack of representation of minority groups in public office. Studies have shown that higher socioeconomic status—in terms of income, occupation, and/or educational attainment—is correlated with higher participation in politics. This participation is defined as "individual or collective action at the national or local level that supports or opposes state structures, authorities, and/or decisions regarding allocation of public goods"; this action ranges from engaging in activities such as voting in elections to running for public office.
Since median income per capita for minority groups is lower than that of White Americans, and since minority groups are more likely to occupy less gainful employment and achieve lower education levels, there is a lowered likelihood of political participation among minority groups. Education attainment has been proven to dictate income and occupation. And there is a proven disparity between educational attainment of White Americans and minority groups, with only 30% of bachelor's degrees awarded in 2009 to minority groups. Thus socioeconomic status—and therefore political participation—is correlated with race. Research has shown that African Americans, Latino Americans, and Asian Americans are less politically active, by varying degrees, than White Americans.
A consequence of underrepresentation of minority groups in leadership is incongruence between policy and community needs. A study conducted by Kenneth J. Meier and Robert E. England of 82 of the largest urban school districts in the United States showed that African American membership on the school board of these districts led to more policies encouraging more African American inclusion in policy considerations. It has been shown that both passive and active representation of minority groups serves to align constituent policy preference and representation of these opinions, and thereby facilitate political empowerment of these groups.
Special programs
Achievement gaps among students may also manifest themselves in the racial and ethnic composition of special education and gifted education programs. Typically, African American and Hispanic students are enrolled in greater numbers in special education programs than their numbers would indicate in most populations, while these groups are underrepresented in gifted programs. Research shows that these disproportionate enrollment trends may be a consequence of the differences in educational achievement among groups.
Efforts to narrow the achievement gap
The United States has seen a variety of different attempts to narrow the racial achievement gap. These attempts include focusing on the importance of early childhood education, using federal standards based reforms, and implementing institutional changes.
Early childhood education
There are large cognitive and emotional gaps that form at early ages. They persist throughout childhood and strongly influence adult outcomes. The gaps originate before formal schooling begins and persists through childhood and into adulthood. Remediating the problems created by the gaps is not as cost effective as preventing them at the outset. Eight psychologists performed an experiment of infant children born in Quebec in 1997/1998 and followed annually until 7 years of age. Children receiving formal childcare were distinguished from those receiving informal childcare. Children of mothers with low levels of education showed a consistent pattern of lower scores on academic readiness and achievement tests at 6 and 7 years than those of highly educated mothers, unless they received formal childcare. The findings provide further evidence suggesting that formal childcare could represent a preventative means of attenuating effects of disadvantage on children's early academic trajectory. Economic research shows that investment at this stage is both more effective and cost effective than interventions later in a child's life. An evaluation of Chicago Public Schools' federally funded Child Parent Centers find that for every $1 invested in the preschool program, nearly $11 is projected to return to society over the participants' lifetimes. This amount is equivalent to an 18% annual return.
Head Start Program, Title I of the Elementary and Secondary Education Act (ESEA), and various state-funded pre-kindergarten programs target students from low-income families in an attempt to equal the playing field for these children before school begins. The evidence in favor of investing in early childhood education as a means of closing the achievement gap is strong: various studies have a positive and long-lasting effect on academic achievement of low-income and minority students. Evaluations of Head Start have reported positive results. However, fade-out effects were found in Head Start
Critics question whether an emphasis on early childhood education will benefit long-term kindergarten through 12th grade learning. Critics point to fade-out effects found in Head Start. Adam Schaeffer, a policy analyst with the Cato Institute highlights research shows that students make some gains in the first two years after preschool but it fades out after. Recent literature also reveals positive, short-term effects of early childhood education on children's development that weaken over time. Even more substantial is the narrowing of educational achievement levels in the US compared to those of higher-achieving nations, such as Finland and Korea. McKinsey & Company estimate a $1.3 trillion to $2.3 trillion, or a 9 to 16 percent difference in GDP. However, Mary Ellen McGuire, an education policy director at think tank New America Foundations, pointed out that early childhood education isn't intended to be a silver-bullet fix to the educational system. It is merely one aspect. In order for those effects to last high-quality early childhood education needs to be connected to high-quality elementary schools.
Standards-based reform
Standards-based reform has been a popular strategy used to try to eliminate the achievement gap in recent years. The goal of this reform strategy is to raise the educational achievement of all students, not just minorities. Many states have adopted higher standards for student achievement. This type of reform focuses on scores on standardized tests, and these scores show that a disproportionate share of the students who are not meeting state achievement standards are Hispanic and African-American. Therefore, it is not enough for minorities to improve just as much as Whites do—they must make greater educational gains in order to close the gap.
Goals 2000
One example of standards-based reform was Goals 2000, also known as the Educate America Act. Goals 2000 was enacted in 1994 by President Clinton and allowed the federal government a new role in its support for education. It aimed to "provide a framework for meeting the National Education Goals". It was designed to provide resources to states and communities to make sure that all students achieved their full potential by the year 2000. This program set forth eight goals for American students, including all children in America will start school ready to learn, increasing the high school graduation rate to at least 90%, and increasing the standing of American students to first in the world in achievement in math and science. Goals 2000 also placed an emphasis on the importance of technology, promising that all teachers would have modern computers in their classroom and that effective software would be an integral part of the curriculum in every school. President George Bush's No Child Left Behind Act essentially replaced the Goals 2000 program.
No Child Left Behind
The No Child Left Behind Act(NCLB) legislation was signed by President Bush in January 2002 and dramatically expanded federal influence over the nation's more than 90,000 public schools. The main implications of this legislation was states had to conduct annual student assessments linked to state standards to identify schools failing to make "adequate yearly progress" (AYP) toward the stated goal of having all students achieve proficiency in reading and math by 2013–2014 and to institute sanctions and rewards based on each school's AYP status. One of the motivations for this reform is that publicizing detailed information on school-specific performance and linking that "high-stakes" test performance to the possibility of sanctions will improve the focus and productivity of public schools. However, critics charge that test-based school accountability has several negative consequences for the broad cognitive development of children.
Critics argue that NCLB and other test-based accountability policies cause educators to shift resources away from important but non-tested subjects and to focus instruction in math and reading on the relatively narrow set of topics that are most heavily represented on the high-stakes tests. Some even suggest that high-stakes testing may lead school personnel to intentionally manipulate student test scores.
NCLB has shown mixed success in eliminating the racial achievement gap. Although test scores are improving, they are improving equally for all races, which means that minority students are still behind whites. There has also been some criticism as to whether an increase in test scores actually corresponds to improvements in education, since test standards vary from state to state and from year to year.
Institutional changes
Research has shown that making certain changes within schools can improve the performance of minority students. These include lowering class size in schools with a large population of minority students; expanding access to high-quality preschool programs to minority families; and focus on teaching the critical thinking and problem-solving skills that are necessary to retain high-level information.
Charter schools
In the United States there are now 5,042 charter schools serving 1.5 million students in 39 states and Washington, D.C. Although they serve only a fraction of the nation's public school students, charter schools have seized a prominent role in education today. The question of whether charters or traditional public schools do a better job of educating students is still open to debate. The research is highly mixed due the complexities of comparison and wide performance differences among charters.
Charter schools are by definition independent public schools. Although funded with taxpayer dollars, they operate free from many of the laws and regulations that govern traditional public schools. In exchange for that freedom, they are bound to the terms of a contract, or "charter," that lays out a school's mission, academic goals, and accountability procedures. The average charter school enrollment is 372, compared with about 478 in all public schools. Researchers have linked small schools with higher achievement, more individualized instruction, greater safety, and increased student involvement. With their relative autonomy, charter schools are also seen as a way to provide greater educational choice and innovation within the public school system. Another attraction of charter schools is that they often have specialized educational programs. Charters frequently take alternative curricular approaches, emphasize particular fields of study or serve special populations of students. That growth of charter schools has been particularly strong in cities. More than 55 percent of public charter schools were in urban settings. Some charters have high concentrations of minority students because demand for schooling alternatives is highest among such students, whom they say are often poorly served by the traditional public school systems. Lastly, another positive argument for charter schools is that they improve the existing school systems through choice and competition.
However, there are some criticisms of charter schools. There is a high variability in the quality and success of charter schools across the nation. A high-profile report from the American Federation of Teachers (2002), for example, argued that many charter school authorizers have failed to hold the administrators and teachers accountable, leaving some students to languish in low-performing schools. Another concern of critics is that charters are more racially segregated than traditional public schools, thus denying students the educational "benefits associated with attending diverse schools". Skeptics also worry that charter schools unfairly divert resources and policy attention from regular public schools.
Taken together, studies about charter schools are inconclusive and have mixed results. Studies by the Goldwater Institute and California State University-Los Angeles found that students in charter schools show higher growth in achievement than their counterparts in traditional public schools. However, another study by the Institute of Race and Poverty at the University of Minnesota Law show that after two decades of experience, most charter schools in the Twin Cities still underperform comparable traditional public schools and are highly segregated by race and income.
Non-English schools
To evade a shift to English, some Native American tribes have initiated language immersion schools for children, where a native Indian language is the medium of instruction. For example, the Cherokee Nation instigated a 10-year language preservation plan that involved growing new fluent speakers of the Cherokee language from childhood on up through school immersion programs as well as a collaborative community effort to continue to use the language at home. This plan was part of an ambitious goal that in 50 years, 80% or more of the Cherokee people will be fluent in the language. The Cherokee Preservation Foundation has invested $3 million into opening schools, training teachers, and developing curricula for language education, as well as initiating community gatherings where the language can be actively used. Formed in 2006, the Kituwah Preservation & Education Program (KPEP) on the Qualla Boundary focuses on language immersion programs for children from birth to fifth grade, developing cultural resources for the general public and community language programs to foster the Cherokee language among adults.
There is also a Cherokee language immersion school in Tahlequah, Oklahoma that educates students from pre-school through eighth grade. Because Oklahoma's official language is English, Cherokee immersion students are hindered when taking state-mandated tests because they have little competence in English. The Department of Education of Oklahoma said that in 2012 state tests: 11% of the school's sixth-graders showed proficiency in math, and 25% showed proficiency in reading; 31% of the seventh-graders showed proficiency in math, and 87% showed proficiency in reading; 50% of the eighth-graders showed proficiency in math, and 78% showed proficiency in reading. The Oklahoma Department of Education listed the charter school as a Targeted Intervention school, meaning the school was identified as a low-performing school but has not so that it was a Priority School. Ultimately, the school made a C, or a 2.33 grade point average on the state's A-F report card system. The report card shows the school getting an F in mathematics achievement and mathematics growth, a C in social studies achievement, a D in reading achievement, and an A in reading growth and student attendance. "The C we made is tremendous," said school principal Holly Davis, "[t]here is no English instruction in our school's younger grades, and we gave them this test in English." She said she had anticipated the low grade because it was the school's first year as a state-funded charter school, and many students had difficulty with English. Eighth graders who graduate from the Tahlequah immersion school are fluent speakers of the language, and they usually go on to attend Sequoyah High School where classes are taught in both English and Cherokee.
Private schools
Private schools are another institution used in attempt to narrow the racial achievement gap. A disparity between achievement gaps in private and public schools can be seen using a U.S. Department of Education database to compute the average National Assessment of Educational Progress test score differences between black students and white students in both public and private schools.
The table on White/Black NAEP Achievement Differences for Public and Private Schools above, shows a sizeable achievement gap between black and white fourth-graders in both public and private schools. However, the private-sector achievement gap is narrower in the 12th grade than the fourth grade for all of the core NAEP subjects. Public schools, on the other hand, see a larger gap in both writing and mathematics at the 12th-grade level than at the fourth. Averaged across subjects, the public school racial achievement gap is virtually unchanged between fourth and 12th grades, while the gap in private schools is an average of 27.5 percentage points smaller in the 12th grade than the fourth.
The achievement gap closes faster in private schools not because white private school students lose ground with respect to white public school students as they move to higher grades, but because black private school students learn at a substantially higher rate than black public school students. Economist Derek Neal has found that black students attending urban private schools are far more likely to complete high school, gain admission to college, and complete college than similar students in urban public schools. Similarly, in a study comparing graduation rates of all Milwaukee public school students (of all income levels) with those of the low-income participants in the city's private school voucher program, Manhattan Institute Senior Fellow Jay Greene found the voucher students were more than one-and-a-half-times as likely to graduate as public school students.
However, others argue that private schools actually perpetuate and exacerbate the achievement gap. Without controlling for student background differences, private schools scored higher than public schools. However, a study showed that demographic differences between students in public and private schools more than account for the relatively high scores of private schools. In fact, after controlling for these differences, the advantageous "private school effect" disappears and even reverses in most cases. Private schools have selective acceptance and a different demographic. Another criticism is that private schools only serve a small percent of the population and therefore cannot make a huge effect on closing the achievement gap.
Teach For America
Teach for America (TFA) recruits and selects graduates from some of the top colleges and universities across the country to teach in the nation's most challenging K-12 schools throughout the nation. It began in 1990 with 500 teachers and has since expanded to over 4,000 teacher placements in 2010. In the Journal of Policy Analysis and Management they use individual-level student data linked to teacher data in North Carolina to estimate the effects of having a TFA teacher compared to a traditional teacher. According to studies about the effect of different teacher-preparation programs in Louisiana, North Carolina, and Tennessee, TFA is among the most effective sources of new teachers in low-income communities. Each of these statewide studies, conducted between 2009 and 2012, found that corps members often help their students achieve academic gains at rates equal to or larger than those for students of more veteran teachers. The findings show that TFA teachers are in general more effective, according to student exam scores, than traditional teachers that would be in the classroom in their stead. These estimates demonstrate that, compared with traditional teachers with similar levels of experience, TFA teachers have strong positive effects on student test scores. And despite the limitations of TFA teachers, they are no worse than average traditional teachers in teaching math subjects and much more effective in teaching science subjects.
Although TFA teachers tend to have stronger academic credentials, they have not been taught in traditional training programs, are more likely to teach for a few years, and are assigned to some of the most challenging schools in the country. Given these differences, the TFA program has been controversial. Critics of Teach For America point out two of the major problems. The first is that most TFA teachers have not received traditional teacher training. TFA corps members participate in an intensive five-week summer national institute and a two-week local orientation and induction program prior to their first teaching assignment, and therefore some argued they are not as prepared for the demands of the classroom as traditionally trained teachers. The second criticism is that TFA requires only a two-year teaching commitment, and the majority of corps members leave at the end of that commitment. The short tenure of TFA teachers is troubling because research shows that new teachers are generally less effective than more experienced teachers.