
 | ||
In descriptive statistics, the quartiles of a ranked set of data values are the three points that divide the data set into four equal groups, each group comprising a quarter of the data. A quartile is a type of quantile. The first quartile (Q1) is defined as the middle number between the smallest number and the median of the data set. The second quartile (Q2) is the median of the data. The third quartile (Q3) is the middle value between the median and the highest value of the data set.
Contents
In applications of statistics such as epidemiology, sociology and finance, the quartiles of a ranked set of data values are the four subsets whose boundaries are the three quartile points. Thus an individual item might be described as being "in the upper quartile".
Computing methods
For discrete distributions, there is no universal agreement on selecting the quartile values.
Method 1
- Use the median to divide the ordered data set into two halves.
- If there are an odd number of data points in the original ordered data set, do not include the median (the central value in the ordered list) in either half.
- If there are an even number of data points in the original ordered data set, split this data set exactly in half.
- The lower quartile value is the median of the lower half of the data. The upper quartile value is the median of the upper half of the data.
This rule is employed by the TI-83 calculator boxplot and "1-Var Stats" functions.
Method 2
- Use the median to divide the ordered data set into two halves.
- If there are an odd number of data points in the original ordered data set, include the median (the central value in the ordered list) in both halves.
- If there are an even number of data points in the original ordered data set, split this data set exactly in half.
- The lower quartile value is the median of the lower half of the data. The upper quartile value is the median of the upper half of the data.
The values found by this method are also known as "Tukey's hinges"; see also midhinge.
Method 3
- If there are an even number of data points, then Method 3 is the same as either method above since the median is no single datum.
- If there are (4n+1) data points, then the lower quartile is 25% of the nth data value plus 75% of the (n+1)th data value; the upper quartile is 75% of the (3n+1)th data point plus 25% of the (3n+2)th data point.
- If there are (4n+3) data points, then the lower quartile is 75% of the (n+1)th data value plus 25% of the (n+2)th data value; the upper quartile is 25% of the (3n+2)th data point plus 75% of the (3n+3)th data point.
This always gives the arithmetic mean of Methods 1 and 2; it ensures that the median value is given its correct weight, and thus quartile values change as smoothly as possible as additional data points are added.
Example 1
Ordered Data Set: 6, 7, 15, 36, 39, 40, 41, 42, 43, 47, 49
Example 2
Ordered Data Set: 7, 15, 36, 39, 40, 41
As there are an even number of data points, all three methods give the same results.
Outliers
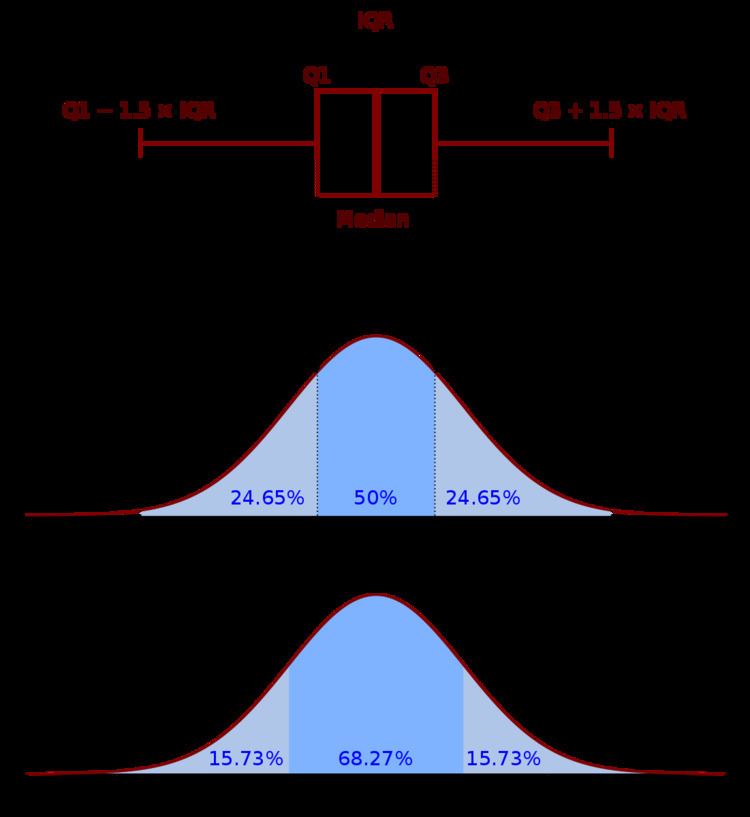
There are methods by which to check for outliers in the discipline of statistics and statistical analysis. As is the basic idea of descriptive statistics, when encountering an outlier, we have to explain this value by further analysis of the cause or origin of the outlier. In cases of extreme observations, which are not an infrequent occurrence, the typical values must be analyzed. In the case of quartiles, the Interquartile Range (IQR) may be used to characterize the data when there may be extremities that skew the data; the interquartile range is a relatively robust statistic (also sometimes called "resistance") compared to the range and standard deviation. There is also a mathematical method to check for outliers and determining "fences", upper and lower limits from which to check for outliers.
After determining the first and third quartiles and the interquartile range as outlined above, then fences are calculated using the following formula:
where Q1 and Q3 are the first and third quartiles, respectively. The Lower fence is the "lower limit" and the Upper fence is the "upper limit" of data, and any data lying outside these defined bounds can be considered an outlier. Anything below the Lower fence or above the Upper fence can be considered such a case. The fences provide a guideline by which to define an outlier, which may be defined in other ways. The fences define a "range" outside of which an outlier exists; a way to picture this is a boundary of a fence, outside of which are "outsiders" as opposed to outliers.