
 | ||
The quadrant count ratio (QCR) is a measure of the association between two quantitative variables. The QCR is not commonly used in the practice of statistics; rather, it is a useful tool in statistics education because it can be used as an intermediate step in the development of Pearson's correlation coefficient.
Contents
Definition and properties
To calculate the QCR, the data are divided into quadrants based on the mean of the
where
The QCR is always between −1 and 1. Values near −1, 0, and 1 indicate strong negative association, no association, and strong positive association (as in Pearson's correlation coefficient). However, unlike Pearson's correlation coefficient the QCR may be −1 or 1 without the data exhibiting a perfect linear relationship.
Example
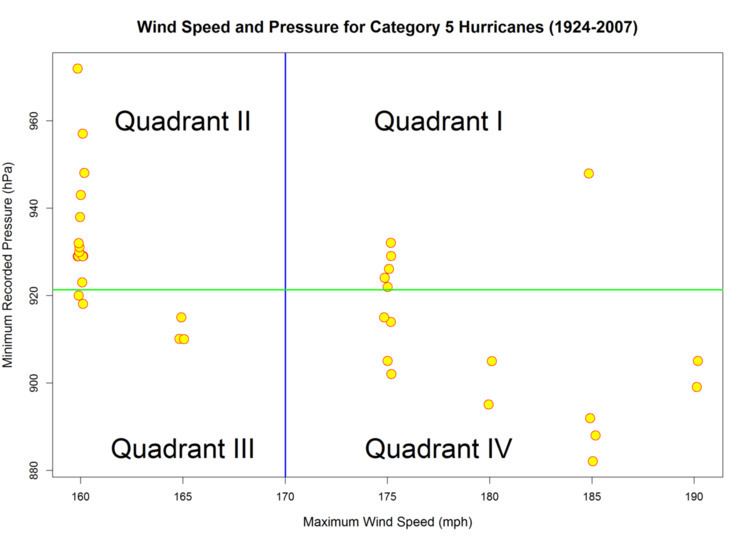
The scatterplot shows the maximum wind speed (X) and minimum pressure (Y) for 35 Category 5 Hurricanes. The mean wind speed is 170 mph (indicated by the blue line), and the mean pressure is 921.31 hPa (indicated by the green line). There are 6 observations in Quadrant I, 13 observations in Quadrant II, 5 observations in Quadrant III, and 11 observations in Quadrant IV. Thus, the QCR for these data is