
 | ||
qCO (quantium Medical Cardiac Output) uses impedance cardiography in a simple, continuous, and non-invasive way to estimate the Cardiac output (CO) and other hemodynamic parameters such as the Stroke Volume (SV) and Cardiac index (CI). The CO estimated by the qCO monitor is referred to as the “qCO”. The impedance plethysmography allows determining changes in volume of the body tissues based on the measurement of the electric impedance at the body surface.
Contents
- What is the impedance cardiography
- Detecting characteristic points of the ICG signal problems and solutions
- Foundation and features of the different methods
- Benefits of using the qCO
- The Cardiac Output CO
- The Stroke Volume Variation SVV
- The Goal Directed Therapy GDT
- The Passive Leg Raising test PLR
- The Frank Starlings curve
- The current qCO utilities can be summarized in
- Other parameters provided by the qCO
- References
The assessment of Cardiac Output (CO) is important because it reveals the main cardiac function: the supply of blood to tissues. CO reflects the hemodynamic flow and hence the transport of oxygen; its clinical applications by non-invasive continuous hemodynamic monitoring are especially useful for some medical specialties like anaesthesiology, emergency care and cardiology, for example to prevent hypoperfusion and to guide fluid administration.
Several authors advocate the high reliability and good correlation of cardiography impedance compared to others techniques more established. Nevertheless, some detractors complain about the sensitivity of the technique to artefacts such as the electromyography or breathing movements.
What is the impedance cardiography?
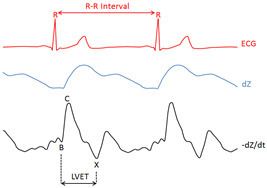
The Impedance Cardiography (ICG or Ztot) signal represents the changes of the thoracic impedance due to variations in the blood flow. In practice, the raw Ztot signal (in O) is transformed to the –dZ/dt waveform (filtered negative first derivative, in O x s-1) by using the first derivative to remark the inflection points of the raw Ztot signal. The most important characteristics points of the –dZ/dt waveform are B, C and X points (see figure 2). All these points are associated to distinct physiological events within the systolic part of the cardiac cycle, i.e., located after the QRS complex onset. In that sense, the R wave from the ECG signal can be an important reference for detecting such events.
Detecting characteristic points of the ICG signal: problems and solutions.
The ICG signal is extremely sensitive to artefacts due to movements and respiration. Baseline variations can considerably alter the dZ/dtmax point and the dependent hemodynamic parameters. High frequency interferences also can affect the accuracy in estimating some characteristics points, essentially the B point, affecting the LVET dependent parameters. The qCO’s algorithm uses classical and advanced adaptive filtering techniques to minimize such problems with good results. The algorithm applies a band pass filtering stage, which attenuates both the baseline drifts (due to movement or respiration) and the high-frequency signal. Also, it features Adaptive Neuro Fuzzy Inference System (ANFIS), for higher accuracy, which is able to obliterate even artefacts such as the electrosurgical noise.
Foundation and features of the different methods.
Since its discovery, the use of CO monitoring has been restricted to certain kind of patients because of the risk of the classical procedures. Lately, new kinds of methods and devices have been developed. Nowadays, at practice, the method election is determined mainly by the features of the patients and the possibilities of the hospital to accede to this technology. Different CO monitor methods can be characterized by their invasiveness or their ability to measure continuously. The most ideal should be reliable, continuous, non-invasive, easy to use and cost-effective. The invasive methods like the still gold standard method Swan-ganz catheter (pulmonary artery catheter), based on transcardiac thermodilution, are being replaced by its invasiveness; hence these systems will not be inspected in this document. The minimally invasive methods also require catheterization, but less harmful. One of them is the Thermodilution Transpulmonary (TDTP), developed in the late 90’s, which presents risk of iatrogenic effect effects such as pneumothorax, Bleeding, infection, thrombosis or vascular ischemia, inherent to the requirement of both arterial and central venous catheter. As calibrating method, this system performs a thermodilution curve by measuring the changes in blood temperature due to the injection of cold serum and calculates the CO intermittently through a modified equation of Stewart-Hamilton. Furthermore, this method lets a continuous reading of the CO through the analysis of the arterial Pulse Pressure (PP) wave. Admittedly, these systems have some limitations, related for example to the thermodilution, such as thermic artefacts due to the injection of another serums or during the extracorporeal purification treatment (this therapy is required by approximately the 5% of patients in critical areas). Most of the monitors able to provide a continuous measure of the CO, are based on the analysis of the arterial blood pressure(BP) curve, called pulse contour methods. They are founded by the fact that the pulse pressure is proportional to the ejection volume; however, this is only true when aortic resistance remains constant, hence, these methods have some limitations such as obesity, which affects the arterial distensibility, or aortic regurgitation. Furthermore, the values may be modified in patients with Intra-Aortic Balloon Pumps (IABP) or unstable arterial signal as in cases of severe arrhythmias or ventricular extrasystolia. The signal can be altered also by shock or hypothermia states because of the peripheral vasoconstriction or arterial spasm. Usually for calculating the stroke volume, the methods based on pulse wave analysis need previous and periodic calibrations that must be done in the same patient, which is a drawback. The main non-invasive methods can be classified in two groups. The first group is formed by different variations of the echocardiography and echo-Doppler techniques and the second group is comprised by the aortic bioimpedance and bioreactance.
Benefits of using the qCO
Doppler or echocardiography systems cannot assess the CO continuously. The continuous assessment capability is the major advantage of the qCO device. This is especially important to predict if the patient is fluid responsive in cases of hemodynamic instability or circulatory shock, which can be assessed with a simple test named Passive Leg Raising (PLR, described in detail below), for which, the quick variations in the CO should be detected. Another benefit is the fact that qCO is fully non-invasive, thus avoiding risks for the patient. Further, it does not need to be calibrated, that allows accelerating and simplifying the monitoring, thereby, providing a large benefit for both the patients and clinicians. The Pulse Pressure Variation (PPV) method is influenced by mechanical ventilation, due to changes in the pleural pressure, hence, such monitoring should not be recommended for patients who are not being mechanically ventilated with a regular tidal volume.
The Cardiac Output (CO)
The average resting CO is 5.6 L/min for a healthy male and 4.9 L/min for a female, decreasing with age and increasing with Body Surface Area (BSA).
What can cause a CO variation?
Changes in the CO can be determined by Heart rate (HR) and Stroke Volume (SV). The SV in turn, depends on three general factors: pre-load, post-load and myocardial contractility.
In the field of anaesthesia the main reason for CO monitoring during surgery are complications that can arise after the immediate postoperative period (such as hypoxemia, tachycardia or oliguria) and also, if the therapeutic intervention becomes complex. Despite of some clinicians believe that the CO monitor can be introduced only when complications emerge, it is recommended to monitor since before the induction in order to have a baseline. Fluid administration in the intraoperative period is part of the daily practice in anaesthesiology. Several studies have demonstrated that the time of administering fluid therapy can be more important than the volume dispensed; thus the treatment guided by BP is primitive, whereas the functional parameters CO and SV can detect easily and quickly the preload variations In the branch of medicine intensive care, the CO and other related parameters may be useful for the differential diagnosis of shock states such as hypovolemic shock, cardiogenic or septic.
The Stroke Volume Variation (SVV)
The rise of volume is the main therapy elected to improve oxygen delivery. However, approximately, only 50% of subjects respond to fluids by increasing SV. The treatment of non-responsive patients can promote deleterious effects in the pulmonary system due to the increase in extravascular fluid. Hence it is important to have a tool to determine this condition. It is called SVV to the physiological variations, due to changes in intra-thoracic pressure of spontaneous breathing, which diminish the arterial pulse pressure during inspiration and increase it during inspiration; however if the SVV decreases too much, it can be termed paradoxical pulse, and can be related to different pathologies such EPOC or pericarditis. In mechanically ventilated patients, the same process takes place in reverse, due to the positive pressure. Therefore, the normal values of SVV depend on the ventilation mode, and it can be calculated through the SV with the formula:
SVV may be fairly sensitive and specific used as a dynamic indicator of the volume status to answer the question: “Does your patient is fluid responsive?”, compared to the conventional parameters. However, using the SVV should not be recommended to interpret the situation of patients with arrhythmias or vasodilator therapy. Also, to avoid natural variations, the patients must be under mechanical ventilation.
The Goal Directed Therapy (GDT)
A critical point for the fluid management in some medical specialties is to adjust the intravascular volume replacement. An incorrect practice can seriously affect the organ function and hence the outcome. Guiding fluid management using standard physiologic variables such as BP and HR, because of their regulated nature, is usually insensitive to changes in intravascular volume and may be misleading for example occulting a hypo-perfusion state. Therefore, optimizing the cardiac preload with fluid administration guided by BP is not reliable.
With the formula to achieve objectives, called Goal Directed Therapy (GDT), Rivers (2001) demonstrated how to reduce mortality in patients with severe sepsis and septic shock through the optimization of different haemodynamic variables for a dynamic and individualized view, instead of maintaining only an adequate Arterial Pressure (AP). Later publications support that the intraoperative GDT, used to maintain an adequate systemic oxygenation, can safeguard organs especially sensible from perioperative hypo-perfusion. High risk patients or even less pernicious patients to major surgery could profit from GDT by reducing incidence of postoperative complications, thus, improving and accelerating the outcome.
The CO measurement in cardiology provides rewarding diagnostic and prognostic information for the management of patients with left- and right-sided cardiac dysfunction. Pulmonary Arterial Hypertension (PAH) may diminish the CO and promote right-sided heart failure, which untreated could be fatal. A simultaneous measurement of the preload also enables to assay the blood flow levels to discard states of hypovolemia or hypervolemia.
The Passive Leg Raising test (PLR)
For the fluid responsiveness evaluation, a small amount of solution can be previously administered as a tester, though this method is not recommended because it is irreversible. Another option is the passive leg raising test, which consists of inducing a fast and transient hemodynamic challenge without fluid infusion. By modifying the patient’s position, a volume of venous blood from the lower body toward the right heart it is transferred, simulating an infusion of approximately 300ml.
An increase in the CO (of = 10%) and AP within the next 60–90 seconds after leg elevation indicates a positive result, suggesting that the patient is fluid responsive and might benefit from additional fluid. By contrast if the test is negative, the patient should not be treated as it would be harmful. The fluid overload can raise extravascular water causing deleterious side effects in lungs.
The Frank Starling’s curve
The basic mechanisms for the haemodynamic regulation are:
The explanation why the heart is capable of adapting to growing volumes of blood flow is called 'Frank-Starling’s mechanism', which says that the more distended are the muscle during the filling, the more strength of contraction and quantity of blood pumped by the left-ventricle to the aorta. When the heart reaches a physiological limitation, then blood pumping cannot increase, although the venous return is further increased. The SVV contributes to know the state of volemia in ventilated patients and designates the point on the Frank-Starling curve where the patient is.
The current qCO utilities can be summarized in
Other parameters provided by the qCO
In addition to cardiac function, the qCO also evaluates indirectly other related field as is the Parasympathetic Nervous System (PNS), through the evaluation of the R-R intervals and Heart Rate Variability (HRV or beat-to-beat variation). Since 1960 the HRV has been analysed. Nowadays, it has become a widely used tool for study the ANS modulation in clinical areas such as cardiology. Even though, its utility is not well known yet. The interest lies in its profound relation with the breathing, ANS and cardiac autonomic regulation.
The most relevant and validated capacity is to prognosticate the coronary heart disease patients, accordingly, a reduced HRV is related to high risk of mortality after a myocardial infarction. Another important point is the fact that the Inflammation is stimulated by effect of the parasympathetic nervous system and inhibited by the sympathetic, thereby, could also be measured through the R-R intervals to guide the physician.
Several reports maintain that the HRV analysis is a highly accurate indicator of the autonomic dysfunction in alcoholic and diabetic subjects. Also, it is growing the interest in apply the HRV to evaluate the neurologic function, and the best results have been found out in the psychiatric patients. Regarding the anaesthesia and critical care fields, the ANS dysfunction should be considered because it is related to high morbidity and mortality in patients undergoing surgery under general anaesthesia effect. Naturally, events as the tracheal intubation and inhalation agents can produce quick variations in ANS. Also, should be regarded in critical patients who may show a worse outcome when it is added to certain illnesses such as sepsis [24,25].
The HRV depends on the age, sex, and also other physiological variations such as hormonal components, genetics, exercise, environmental factors, thermoregulation, etc. A controlled recording could explain variations in ANS due to physiology, pharmacology or pathology
There exist several systems for quantifying the HRV, nevertheless, none of them have shown better result than others. The most widely used methods for the HRV analysis can be grouped under time-domain and frequency-domain, the qCO offers the following values: