
 | ||
A prognostic chart is a map displaying the likely weather forecast for a future time. Such charts generated by atmospheric models as output from numerical weather prediction and contain a variety of information such as temperature, wind, precipitation and weather fronts. They can also indicate derived atmospheric fields such as vorticity, stability indices, or frontogenesis. Forecast errors need to be taken into account and can be determined either via absolute error, or by considering persistence and absolute error combined.
Contents
Definition
The forecast map showing the state of the atmosphere at a future time is called a prognostic chart. Prognostic charts generated by computer models are sometimes referred to as machine-made forecasts.
Variety
Surface weather prognostic charts for mariners indicate the positions of high and low pressure areas, as well as frontal zones, up to five days into the future. Surface wind direction and speed is also forecast on this type of chart. Wave prognostic charts show the expected sea state at some future time. Low-level prognostic charts used by aviators show the forecast between the Earth's surface and 24,000 feet (7,300 m) above sea level over the next two days. They show areas where visual flight rules are in effect, instrument flight rules are in effect, the height of the freezing level, the location of weather features, and areas of moderate to severe turbulence. Prognostic charts can be made of isentropic surfaces (along a certain potential temperature surface determined in kelvins) in regards to moisture advection, mean temperatures at the surface, mean sea level pressures, and precipitation either for a single day or multiple days. For purposes of severe weather, prognostic charts can be issued to depict current weather watches, convective outlooks for thunderstorms multiple days into the future, and fire weather outlooks.
Manual
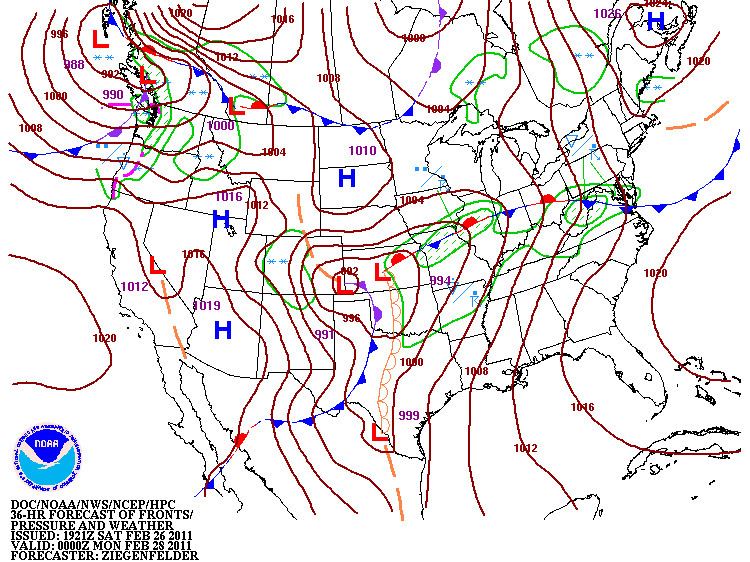
Manual prognostic charts depict tropical cyclones, turbulence, weather fronts, rain and snow areas, precipitation type and coverage indicators, as well as centers of high and low pressure. Within the United States, these type of maps are generated by the Hydrometeorological Prediction Center, the Storm Prediction Center, the Ocean Prediction Center, and the National Hurricane Center. The Aviation Weather Center re-sends these maps, and also generates specialized maps for aviation.
Automated
Atmospheric models are computer programs that produce meteorological information, including prognostic charts, for future times at given locations and altitudes. Within any modern model is a set of equations, known as the primitive equations, used to predict the future state of the atmosphere. These equations—along with the ideal gas law—are used to evolve the density, pressure, and potential temperature scalar fields and the velocity vector field of the atmosphere through time. Additional transport equations for pollutants and other aerosols are included in some primitive-equation mesoscale models as well. These equations are initialized from the analysis data and rates of change are determined. These rates of change predict the state of the atmosphere a short time into the future; the time increment for this prediction is called a time step. This time stepping is repeated until the solution reaches the desired forecast time. Time steps for global models are on the order of tens of minutes, while time steps for regional models are between one and four minutes. The global models are run outwards to varying times into the future. The UKMET Unified Model is run six days into the future, the European Centre for Medium-Range Weather Forecasts model is run out to 10 days into the future, while the Global Forecast System model run by the Environmental Modeling Center is run 16 days into the future.
Verification
Around 1950, a good surface prognostic chart was considered to be one whose isobars were in the correct location. By 1957, it was proposed when isobars or height lines at the 500 hectopascals (15 inHg) pressure level in the atmosphere were being verified, that the degree of persistence should be considered so as to avoid getting bad forecasts for slow moving systems too much credit.