
 | ||
Production theory is the study of production, or the economic process of converting inputs into outputs. Production uses resources to create a good or service that is suitable for use, gift-giving in a gift economy, or exchange in a market economy. This can include manufacturing, construction, storing, shipping, and packaging. Some economists define production broadly as all economic activity other than consumption. They see every commercial activity other than the final purchase as some form of production.
Contents
- Production as a source of economic well being
- Stakeholders of production
- Main processes of a producing company
- Production growth and performance
- Absolute total and average income
- Production models
- Production income model
- Production analysis model
- Accounting and interpreting
- Objective functions
- The procedure for formulating objective functions
- The dual approach for the formulation
- References
Production is a process, and as such it occurs through time and space. Because it is a flow concept, production is measured as a “rate of output per period of time”. There are three aspects to production processes:
- the quantity of the good or service produced,
- the form of the good or service created,
- the temporal and spatial distribution of the good or service produced.
A production process can be defined as any activity that increases the similarity between the pattern of demand for goods and services, and the quantity, form, shape, size, length and distribution of these goods and services available to the market place.
Production is a process that combines various material inputs and immaterial inputs (plans, know-how) to make something for consumption (the output). It is the act of creating output, a good or service that has value and contributes to the utility of individuals.
Economic well-being is created in a production process, meaning all economic activities that aim directly or indirectly to satisfy human needs. The degree to which the needs are satisfied is often accepted as a measure of economic well-being. In production, two features explain increasing economic well-being. They are improving quality-price-ratio of commodities and increasing incomes from growing and more efficient market production.
The most important forms of production are
To understand the origin of the economic well-being, we must understand these three production processes. All of them produce commodities that have value and contribute to well-being of individuals.
The satisfaction of needs originates from the use of the commodities produced. The need satisfaction increases when the quality-price-ratio of the commodities improves and more satisfaction is achieved at less cost. Improving the quality-price-ratio of commodities is to a producer an essential way to improve the competitiveness of products but this kind of gains distributed to customers cannot be measured with production data. To the procucer, improving product competitiveness often means lower product prices, and therefore losses in incomes, which the producer hopes sales growth will offset.
Economic well-being also increases due to the growth of incomes that are gained from the growing and more efficient market production. Market production is the only one production form that creates and distributes incomes to stakeholders. Public production and household production are financed by the incomes generated in market production. Thus market production has a double role in creating well-being, i.e., the role of producing developing commodities and the role to creating income. Because of this double role market production is the “primus motor” of economic well-being and therefore here under review.
Production as a source of economic well-being
In principle there are two main activities in an economy, production and consumption. Similarly there are two kinds of actors, producers and consumers. Well-being is made possible by efficient production and by the interaction between producers and consumers. In the interaction, consumers can be identified in two roles both of which generate well-being. Consumers can be both customers of the producers and suppliers to the producers. The customers’ well-being arises from the commodities they are buying and the suppliers’ well-being is related to the income they receive as compensation for the production inputs they have delivered to the producers.
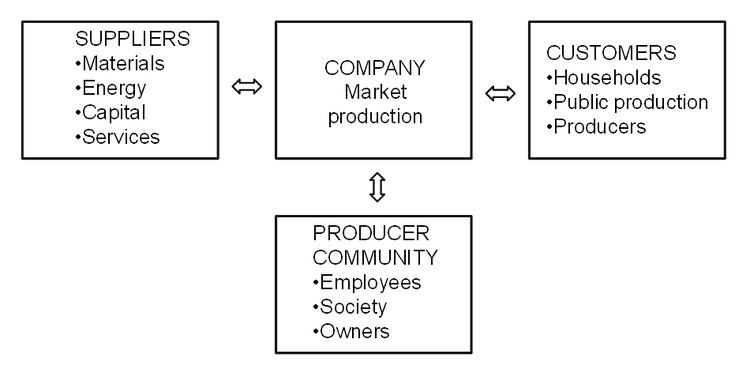
Stakeholders of production
Stakeholders of production are persons, groups or organizations with an interest in a producing company. Economic well-being originates in efficient production and it is distributed through the interaction between the company’s stakeholders. Stakeholders of companies are economic actors with an economic interest in a company. Based on the similarities of their interests, stakeholders can be classified into three groups to differentiate their interests and mutual relations. The three groups are:
The interests of these stakeholders and their relations to companies are described briefly below. Our purpose is to establish a framework for further analysis.
Customers
The customers of a company are typically consumers, other market producers or producers in the public sector. Each of them has their individual production functions. Due to competition, the price-quality-ratios of commodities tend to improve and this brings the benefits of better productivity to customers. Customers get more for less. In households and the public sector this means that more need satisfaction is achieved at less cost. For this reason the productivity of customers can increase over time even though their incomes remain unchanged.
Suppliers
The suppliers of companies are typically producers of materials, energy, capital, and services. They all have their individual production functions. The changes in prices or qualities of supplied commodities have an effect on both actors’ (company and suppliers) production functions. We come to the conclusion that the production functions of the company and its suppliers are in a state of continuous change.
The inputs or resources used in the production process are called factors of production by economists. The inputs are usually grouped into four categories. These factors are:
In the “long run”, all of these factors of production can be adjusted by management. The “short run”, however, is defined as a period in which at least one of the factors of production is fixed.
A fixed factor of production is one whose quantity cannot readily be changed. Examples include major pieces of equipment, suitable factory space, and key managerial personnel.
A variable factor of production is one whose usage rate can be changed easily. Examples include electrical power consumption, transportation services, and most raw material inputs. In the short run, a firm’s “scale of operations” determines the maximum number of outputs that can be produced. In the long run, there are no scale limitations.
Producer community
The incomes are generated for those participating in production, i.e., the labour force, society and owners. These stakeholders are referred to here as producer communities or, in shorter form, as producers. The producer communities have a common interest in maximizing their incomes. These parties that contribute to production receive increased incomes from the growing and developing production.
The well-being gained through commodities stems from the price-quality relations of the commodities. Due to competition and development in the market, the price-quality relations of commodities tend to improve over time. Typically the quality of a commodity goes up and the price goes down over time. This development favourably affects the production functions of customers. Customers get more for less. Consumer customers get more satisfaction at less cost. This type of well-being generation can only partially be calculated from the production data. The situation is presented in this study. The producer community (labour force, society, and owners) earns income as compensation for the inputs they have delivered to the production. When the production grows and becomes more efficient, the income tends to increase. In production this brings about an increased ability to pay salaries, taxes and profits. The growth of production and improved productivity generate additional income for the producing community. Similarly the high income level achieved in the community is a result of the high volume of production and its good performance. This type of well-being generation – as mentioned earlier - can be reliably calculated from the production data.
Main processes of a producing company
A producing company can be divided into sub-processes in different ways. The following five are main processes, each with a logic, objectives, theory, and key figures of its own. It is important to examine each individually and also as part of the whole to measure and understand them. These main processes of a company are:
Production output is created in the real process, gains of production are distributed in the income distribution process and these two processes constitute the production process. The production process and its sub-processes, the real process and income distribution process occur simultaneously, and only the production process is identifiable and measurable by the traditional accounting practices. The real process and income distribution process can be identified and measured by extra calculation, and this is why we must analyze them separately to understand the logic of production and its performance.
Real process generates the production output from input, and it can be described by means of the production function. It refers to a series of events in production in which production inputs of different quality and quantity are combined into products of different quality and quantity. Products can be physical goods, immaterial services and most often combinations of both. The characteristics created into the product by the producer imply surplus value to the consumer, and on the basis of the market price this value is shared by the consumer and the producer in the marketplace. This is the mechanism through which surplus value originates to the consumer and the producer likewise. It is worth noting that surplus values to customers cannot be measured from any production data. Instead the surplus value to a producer can be measured. It can be expressed both in terms of nominal and real values. The real surplus value to the producer is an outcome of the real process, real income, and measured proportionally it means productivity.
The concept “real process” in the meaning quantitative structure of production process was introduced in Finnish management accounting in 1960´s. Since then it has been a cornerstone in the Finnish management accounting theory. (Riistama et al. 1971)
Income distribution process of the production refers to a series of events in which the unit prices of constant-quality products and inputs alter causing a change in income distribution among those participating in the exchange. The magnitude of the change in income distribution is directly proportionate to the change in prices of the output and inputs and to their quantities. Productivity gains are distributed, for example, to customers as lower product sales prices or to staff as higher income pay.
The production process consists of the real process and the income distribution process. A result and a criterion of success of the owner is profitability. The profitability of production is the share of the real process result the owner has been able to keep to himself in the income distribution process. Factors describing the production process are the components of profitability, i.e., returns and costs. They differ from the factors of the real process in that the components of profitability are given at nominal prices whereas in the real process the factors are at periodically fixed prices.
Monetary process refers to events related to financing the business. Market value process refers to a series of events in which investors determine the market value of the company in the investment markets.
Production growth and performance
Production gowth is often defined as a production increase of an output of a production process. It is usually expressed as a growth percentage depicting growth of the real production output. The real output is the real value of products produced in a production process and when we subtract the real input from the real output we get the real income. The real output and the real income are generated by the real process of production from the real inputs.
The real process can be described by means of the production function. The production function is a graphical or mathematical expression showing the relationship between the inputs used in production and the output achieved. Both graphical and mathematical expressions are presented and demonstrated. The production function is a simple description of the mechanism of income generation in production process. It consists of two components. These components are a change in production input and a change in productivity.
The figure illustrates an income generation process(exaggerated for clarity). The Value T2 (value at time 2) represents the growth in output from Value T1 (value at time 1). Each time of measurement has its own graph of the production function for that time (the straight lines). The output measured at time 2 is greater than the output measured at time one for both of the components of growth: an increase of inputs and an increase of productivity. The portion of growth caused by the increase in inputs is shown on line 1 and does not change the relation between inputs and outputs. The portion of growth caused by an increase in productivity is shown on line 2 with a steeper slope. So increased productivity represents greater output per unit of input.
The growth of production output does not reveal anything about the performance of the production process. The performance of production measures production’s ability to generate income. Because the income from production is generated in the real process, we call it the real income. Similarly, as the production function is an expression of the real process, we could also call it “income generated by the production function”.
The real income generation follows the logic of the production function. Two components can also be distinguished in the income change: the income growth caused by an increase in production input (production volume) and the income growth caused by an increase in productivity. The income growth caused by increased production volume is determined by moving along the production function graph. The income growth corresponding to a shift of the production function is generated by the increase in productivity. The change of real income so signifies a move from the point 1 to the point 2 on the production function (above). When we want to maximize the production performance we have to maximize the income generated by the production function.
The sources of productivity growth and production volume growth are explained as follows. Productivity growth is seen as the key economic indicator of innovation. The successful introduction of new products and new or altered processes, organization structures, systems, and business models generates growth of output that exceeds the growth of inputs. This results in growth in productivity or output per unit of input. Income growth can also take place without innovation through replication of established technologies. With only replication and without innovation, output increases in proportion to input. (Jorgenson et al. 2014,2) This is the case of income growth through production volume growth.
Jorgenson et al. (2014,2) give an empiric example. They show that the great preponderance of economic growth in the US since 1947 involves the replication of existing technologies through investment in equipment, structures, and software and expansion of the labor force. Further they show that innovation accounts for only about twenty percent of US economic growth.
In the case of a single production process (described above) the output is defined as an economic value of products and services produced in the process. When we want to examine an entity of many production processes we have to sum up the value-added created in the single processes. This is done to avoid double accounting of intermediate inputs. Value-added is obtained by subtracting the intermediate inputs from the outputs. The most well-known and used measure of value-added is the GDP (Gross Domestic Product). It is widely used as a measure of the economic growth of nations and industries.
Absolute (total) and average income
The production performance can be measured as an average or an absolute income. Expressing performance both in average (avg.) and absolute (abs.) quantities is helpful for understanding the welfare effects of production. For measurement of the average production performance, we use the known productivity ratio
The absolute income of performance is obtained by subtracting the real input from the real output as follows:
The real income is the increase of the economic value which can be distributed between the production stakeholders. With the aid of the production model we can perform the average and absolute accounting in one calculation. Maximizing production performance requires using the absolute measure, i.e., the real income and its derivatives as a criterion of production performance.
An important conclusion can be drawn. When we try to maximize the welfare effects of production we have to maximize real income formation. Maximizing productivity leads to a suboptimum, i.e., to losses of incomes.
A practical example illustrates the case. When a jobless person obtains a job in market production we may assume it is a low productivity job. As a result, average productivity decreases but the real income per capita increases. Furthermore, the well-being of the society also grows. This example reveals the difficulty to interpret the total productivity change correctly. The combination of volume increase and total productivity decrease leads in this case to the improved performance because we are on the “diminishing returns” area of the production function. If we are on the part of “increasing returns” on the production function, the combination of production volume increase and total productivity increase leads to improved production performance. Unfortunately we do not know in practice on which part of the production function we are. Therefore, a correct interpretation of a performance change is obtained only by measuring the real income change.
Production models
A production model is a numerical description of the production process and is based on the prices and the quantities of inputs and outputs. There are two main approaches to operationalize the concept of production function. We can use mathematical formulae, which are typically used in macroeconomics (in growth accounting) or arithmetical models, which are typically used in microeconomics and management accounting. We do not present the former approach here but refer to the survey “Growth accounting” by Hulten 2009.
We use here arithmetical models because they are like the models of management accounting, illustrative and easily understood and applied in practice. Furthermore, they are integrated to management accounting, which is a practical advantage. A major advantage of the arithmetical model is its capability to depict production function as a part of production process. Consequently, production function can be understood, measured, and examined as a part of production process.
Different production models describe different interests. Here, we use a production income model and a production analysis model to demonstrate production function as a phenomenon and measurable quantity.
Production income model
The scale of success run by a going concern is manifold, and there are no criteria that might be universally applicable to success. Nevertheless, there is one criterion by which we can generalise the rate of success in production. This criterion is the ability to produce surplus value. As a criterion of profitability, surplus value refers to the difference between returns and costs, taking into consideration the costs of equity in addition to the costs included in the profit and loss statement as usual. Surplus value indicates that the output has more value than the sacrifice made for it, in other words, the output value is higher than the value (production costs) of the used inputs. If the surplus value is positive, the owner’s profit expectation has been surpassed.
The table presents a surplus value calculation. We call this set of production data a basic example and we use the data through the article in illustrative production models. The basic example is a simplified profitability calculation used for illustration and modelling. Even as reduced, it comprises all phenomena of a real measuring situation and most importantly the change in the output-input mix between two periods. Hence, the basic example works as an illustrative “scale model” of production without any features of a real measuring situation being lost. In practice, there may be hundreds of products and inputs but the logic of measuring does not differ from that presented in the basic example.
In this context we define the quality requirements for the production data used in productivity accounting. The most important criterion of good measurement is the homogenous quality of the measurement object. If the object is not homogenous, then the measurement result may include changes in both quantity and quality but their respective shares remain unclear. In productivity accounting this criterion requires that every item of output and input must appear in accounting as being homogenous. In other words, the inputs and the outputs are not aggregated in measuring and accounting. If they are aggregated, they are no longer homogenous and hence measurement results may be biased.
Both the absolute and relative surplus value have been calculated in the example. Absolute value is the difference of the output and input values and the relative value is their relation, respectively. The surplus value calculation in the example is at a nominal price, calculated at the market price of each period.
Production analysis model
A model used here is a typical production analysis model that helps calculate the outcome of the real process, income distribution process and production process. The starting point is a profitability calculation using surplus value as a criterion of profitability. The surplus value calculation is the only valid measure for understanding the connection between profitability and productivity or understanding the connection between real process and production process. A valid measurement of total productivity necessitates considering all production inputs, and the surplus value calculation is the only calculation to conform to the requirement. If we omit an input in productivity or income accounting, this means that the omitted input can be used unlimitedly in production without any cost impact on accounting results.
Accounting and interpreting
The process of calculating is best understood by applying the term ceteris paribus, i.e., "all other things being the same," stating that at a time only the impact of one changing factor be introduced to the phenomenon being examined. Therefore, the calculation can be presented as a process advancing step by step. First, the impacts of the income distribution process are calculated, and then, the impacts of the real process on the profitability of the production.
The first step of the calculation is to separate the impacts of the real process and the income distribution process, respectively, from the change in profitability (285.12 – 266.00 = 19.12). This takes place by simply creating one auxiliary column (4) in which a surplus value calculation is compiled using the quantities of Period 1 and the prices of Period 2. In the resulting profitability calculation, Columns 3 and 4 depict the impact of a change in income distribution process on the profitability and in Columns 4 and 7 the impact of a change in real process on the profitability.
The accounting results are easily interpreted and understood. We see that the real income has increased by 58.12 units from which 41.12 units come from the increase of productivity growth and the rest 17.00 units come from the production volume growth. The total increase of real income (58.12) is distributed to the stakeholders of production, in this case 39.00 units to the customers and to the suppliers of inputs and the rest 19.12 units to the owners.
Here we can make an important conclusion. Income formation of production is always a balance between income generation and income distribution. The income change created in a real process (i.e., by production function) is always distributed to the stakeholders as economic values within the review period. Accordingly, the changes in real income and income distribution are always equal in terms of economic value.
Based on the accounted changes of productivity and production volume values we can explicitly conclude on which part of the production function the production is. The rules of interpretations are the following:
The production is on the part of “increasing returns” on the production function, when
The production is on the part of “diminishing returns” on the production function, when
In the basic example the combination of volume growth (+17.00) and productivity growth (+41.12) reports explicitly that the production is on the part of “increasing returns” on the production function (Saari 2006 a, 138–144).
Another production model (Production Model Saari 1989) also gives details of the income distribution (Saari 2011,14). Because the accounting techniques of the two models are different, they give differing, although complementary, analytical information. The accounting results are, however, identical. We do not present the model here in detail but we only use its detailed data on income distribution, when the objective functions are formulated in the next section.
Objective functions
An efficient way to improve the understanding of production performance is to formulate different objective functions according to the objectives of the different interest groups. Formulating the objective function necessitates defining the variable to maximize (or minimize). After that other variables are considered as constraints. The most familiar objective function is profit maximization, which is also included in this case. Profit maximization is an objective function that stems from the owner’s interest and all other variables are constraints in relation to maximizing of profits.
The procedure for formulating objective functions
The procedure for formulating different objective functions, in terms of the production model, is introduced next. In the income formation from production the following objective functions can be identified:
These cases are illustrated using the numbers from the basic example. The following symbols are used in the presentation: The equal sign (=) signifies the starting point of the computation or the result of computing and the plus or minus sign (+ / -) signifies a variable to add or subtract from the function. A producer means here the producer community, i.e., labour force, society and owners.
Objective function formulations can be expressed in a single calculation that concisely illustrates the logic of the income generation, the income distribution and the variables to maximize.
The calculation resembles an income statement starting with the income generation and ending with the income distribution. The income generation and the distribution are always in balance so that their amounts are equal. In this case it is 58.12 units. The income generated in the real process is distributed to the stakeholders during the same period. Three variables can be maximized: real income, producer income, and owner income. Producer income and owner income are practical quantities because they are addable quantities and they can be computed quite easily. Real income is normally not an addable quantity and in many cases it is difficult to calculate.
The dual approach for the formulation
Here we have to add that the change of real income can also be computed from the changes in income distribution. We have to identify the unit price changes of outputs and inputs and calculate their profit impacts (i.e., unit price change x quantity). The change of real income is the sum of these profit impacts and the change of owner income. This approach is called the dual approach because the framework is seen in terms of prices instead of quantities (ONS 3, 23).
The dual approach has been recognized in growth accounting for long but its interpretation has remained unclear. The following question has remained unanswered: “Quantity based estimates of the residual are interpreted as a shift in the production function, but what is the interpretation of the price-based growth estimates?” (Hulten 2009, 18). We have demonstrated above that the real income change is achieved by quantitative changes in production and the income distribution change to the stakeholders is its dual. In this case the duality means that the same accounting result is obtained by accounting the change of the total income generation (real income) and by accounting the change of the total income distribution.