
 | ||
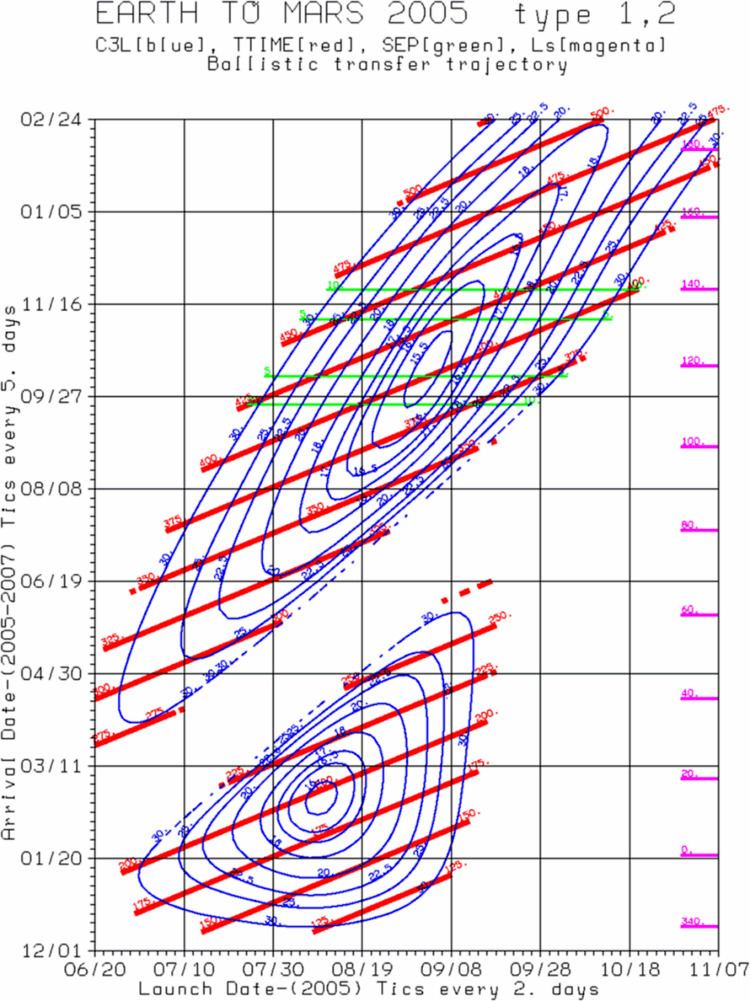
A porkchop plot (also pork-chop plot) is a chart that shows contours of equal characteristic energy (C3) against combinations of launch date and arrival date for a particular interplanetary flight.
Contents
By examining the results of the porkchop plot, engineers can determine when launch opportunities exist (a launch window) that is compatible with the capabilities of a particular spacecraft. A given contour, called a porkchop curve, represents constant C3, and the center of the porkchop the optimal minimum C3. The orbital elements of the solution, where the fixed values are the departure date, the arrival date, and the length of the flight, were first solved mathematically in 1761 by Johann Heinrich Lambert, and the equation is generally known as Lambert's problem (or theorem).
Math
The general form of Characteristic Energy can be computed as:
where
Use
For the Voyager program, engineers at JPL plotted around 10,000 potential trajectories using porkchop plots, from which they selected around 100 that were optimal for the mission objectives. The plots allowed them to reduce or eliminate planetary encounters taking place over the Thanksgiving or Christmas holidays, and to plan the completion of the mission's primary goals before the end of the fiscal year 1981.