
 | ||
A Pople diagram or Pople's Diagram is a diagram which describes the relationship between various calculation methods. It was initially introduced in January 1965 by Sir John Anthony Pople, KBE FRS (31 October 1925 – 15 March 2004), during the Symposium of Atomic and Molecular Quantum Theory in Florida. The Pople Diagram can be either 2-dimension or 3-dimensional, with the axes representing Ab initio quantum chemistry methods, Basis sets used in computational chemistry and treatment of relativity. The diagram attempts to balance calculations by giving all aspects of a computation equal weight.
Contents
History
John Pople first introduced the Pople Diagram during the Symposium on Atomic and Molecular Quantum Theory held on Sanibel Island, Florida, in January 1965. He called it a "hyperbola of quantum chemistry", which illustrates the inverse relationship between the sophistication of a calculational method and the number of electrons in a molecule that can be studied by that method. Alternative (reverse) arrangement of the vertical axis or interchange of the two axes are also possible.
Three-Dimensional Pople Diagrams
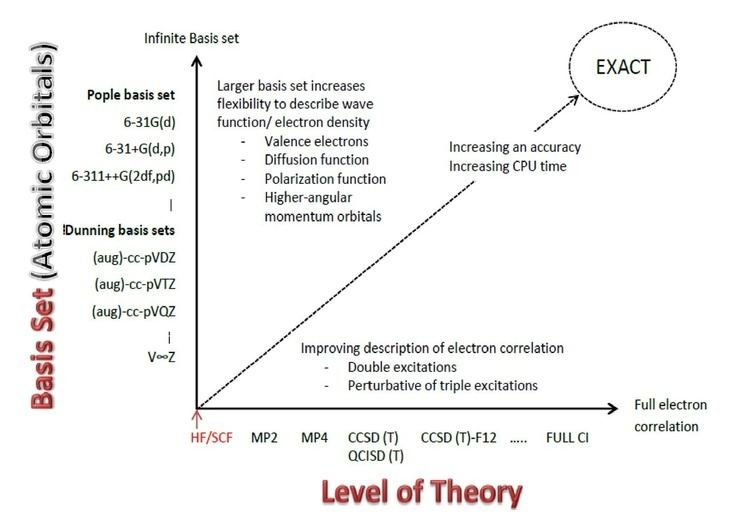
The 2-dimensional Pople diagram describes the convergence of the quantum-mechanical nonrelativistic electronic energy with the size of the basis set and the level of electron correlation included in the wavefunction. In order to reproduce accurate experimental thermochemical properties, secondary energetic contributions have to be considered. The third dimension of the Pople diagram consists of such energetic contributions. These contributions may include: spin–orbit interaction, scalar relativistic, zero-point vibrational energy, and deviations from the Born–Oppenheimer approximation. The three-dimensional Pople diagram (also known as the Csaszar cube) describes the energy contributions involved in quantum chemistry composite methods.