
 | ||
Planograms, also known as plano-grams, plan-o-grams, schematics and POGs, are visual representations of a store's products or services. They are considered a tool for visual merchandising. According to the Oxford Dictionary, "It is a diagram or model that indicates the placement of retail products on shelves in order to maximize sales." Planograms therefore help dictate a retail store's layout. The ultimate effectiveness of the planogram can be measured by sales volume.
Contents
Overview
Planograms are mostly used in retail. A planogram defines where and in what quantity products are placed on a shelving unit. The rules and theories for the creation of a planogram are set under the terms of merchandising. Manufacturers often send planograms to stores ahead of new products. This is useful when a retailer wants multiple store displays to have the same look and feel. Often, a consumer-packaged goods manufacturer will release a new suggested planogram with their new product to show how the product relates to existing products.
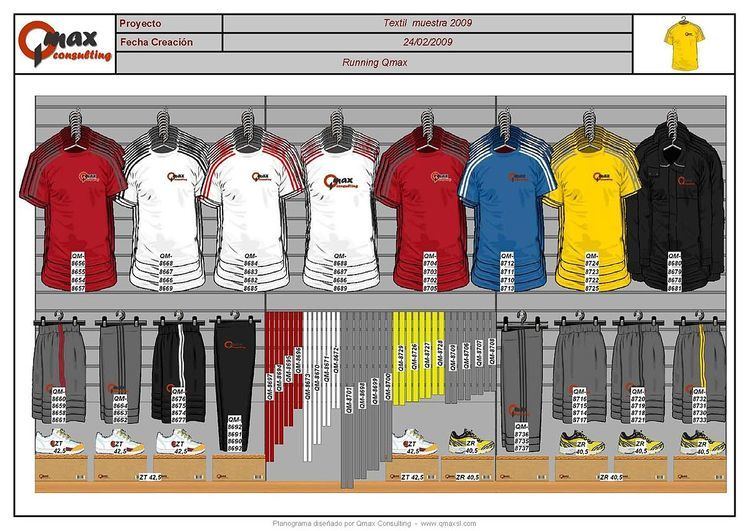
Fast-moving consumer goods organizations and supermarkets largely use text- and box-based planograms that optimize shelf space, inventory turns, and profit margins. Apparel brands and retailers are more focused on presentation and use pictorial planograms that illustrate the look of and also identify each product.
Visual
Visual product placement is supported by different theories, including horizontal, vertical, and block placement. Horizontal product placement increases the concentration of a certain article for customers. Research studies have found that a minimum placement range between 15 centimetres (5.9 in)–30 centimetres (12 in) of one single product is necessary to achieve an increase in customer attention. This also depends on a customer's distance from the unit. Vertical product placement puts products on more than one shelf level to achieve 15 centimetres (5.9 in)–30 centimetres (12 in) of placement space. Similar products are placed in blocks – brands, for example.
Commercial
Commercial placement is determined by both market share placement and margin placement. Market share research companies like ACNielsen collect sales data for various products, and from this data, calculate the market share of a certain product in its market segment. Margin placement is determined by the profit margin of a specific item. Higher margin places a product closer to the front of the store where it is most likely to attract attention.
Derivative targets
Derivative targets:
Creation of planograms
The planogram originated with K-Mart. Planograms are created with the help of planograming software by a Planogram Specialist, Space Planning Specialist or Space Planning Manager. The retail industry utilizes the automated software with the goal of ensuring accurate stocking. As the retail industry grows increasingly competitive, retailers are turning to planogram software to reflect each store’s unique customer desires and localized demand, while maintaining centralized control and supply chain efficiency. For example, some software packages focused upon fast-moving consumer goods and hard goods sectors made some enhancements to transfer parts of shelving elements to single store measurements, which, according to the producers, should increase efficiency.
Retailers are automating the creation of store-specific planograms through use of corporate-level business rules and constraints describing best practice product placements. Such planogramming solutions allow these companies to respond with location and language-specific messaging, pricing, and product placements based on business rules derived from location, campaign, and fixture attributes to create localized assortments.
- Recent advances in store virtualization and collaboration now allow manufacturers, retailers and category management experts from across the globe to work in the same virtual store in real time. By removing the boundaries of distance this enables retailers and manufacturers to have a real choice between black box automated solutions and access to low cost labor pools to perform the same tasks. There are advantages to both approaches. Automation provides near real time results across hundreds of permutations, while low cost labor pools provide the unique human touch that automation so far has failed to deliver.