
 | ||
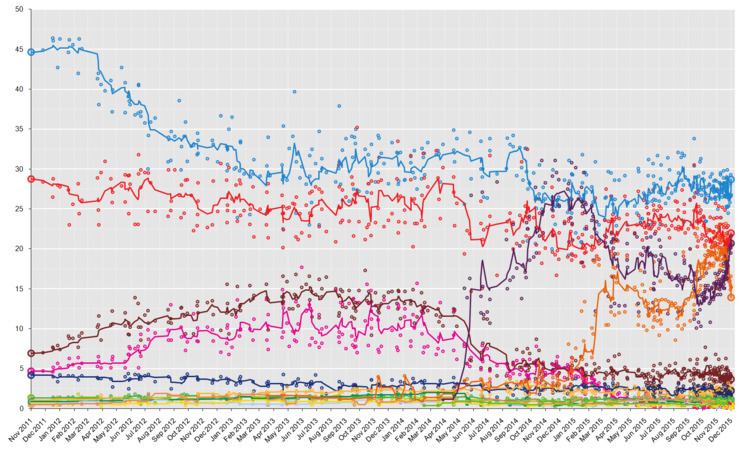
In the run up to the 2015 Spanish general election, various organisations carried out opinion polling to gauge voting intention in Spain. Results of such polls are displayed in this article.
Contents
The date range for these opinion polls are from the previous general election, held on 20 November 2011, to the day the next election was held, on 20 December 2015.
Poll results
Poll results are listed in the tables below in reverse chronological order, showing the most recent first, and using the date the survey's fieldwork was done, as opposed to the date of publication. If such date is unknown, the date of publication is given instead. The highest percentage figure in each polling survey is displayed in bold, and the background shaded in the leading party's colour. In the instance that there is a tie, then no figure is shaded. The lead column on the right shows the percentage-point difference between the two parties with the highest figures. When a specific poll does not show a data figure for a party, the party's cell corresponding to that poll is shown empty.
Multi-scenario poll Poll conducted after legal ban on opinion polls Exit poll
Notes
HT Identifies multi-scenario opinion polls which hypothesize on a high turnout. LT Identifies multi-scenario opinion polls which hypothesize on a low turnout. CV Identifies polling firms that explicitly show their top-line results projected over "candidacy votes", that is, votes going for political parties, excluding blank ballots. This is in contrast to "valid votes", which is the most frequent method of vote projection by opinion pollsters and which do account for blank ballots. In order to obtain data comparable to both the official results projected over "valid votes" as well as projections from other pollsters, a rule of three is applied, considering a comparison between 2011 election results calculated both over "candidacy" and "valid votes". The results of such calculation are shown instead.Seat projections
Opinion polls showing seat projections are displayed in the table below. The highest seat figures in each polling survey have their background shaded in the leading party's colour. In the instance that there is a tie, then no figure is shaded. 176 seats were required for an absolute majority in the Congress of Deputies.
Poll conducted after legal ban on opinion polls
Notes
LV Identifies seat projections done by La Vanguardia over a poll's vote estimations.Rating scale
Poll results showing party leaders' popularity are shown in the table below in reverse chronological order, showing the most recent first. Values are shown in a 0 to 10 scale, with 10 indicating the most positively valued and 0 being the most negatively valued. Values are shaded in a string of colors ranging from dark red to dark green, in accordance with the value awarded to the leader (the color legend is also shown below).