In the run up to the general election on 7 May 2015, various organisations carried out opinion polling to gauge voting intention. Results of such polls are displayed in this article. Most of the polling companies listed are members of the British Polling Council (BPC) and abide by its disclosure rules.
The date range for these opinion polls is from 6 May 2010 (the date of the previous general election) to 7 May 2015.
Most opinion polls cover only Great Britain (England, Scotland and Wales). Separate polls covering constituent countries of the UK and English regions are reported further below while polling of individual constituencies and groups of them (such as groups of marginals) is covered in a separate article.
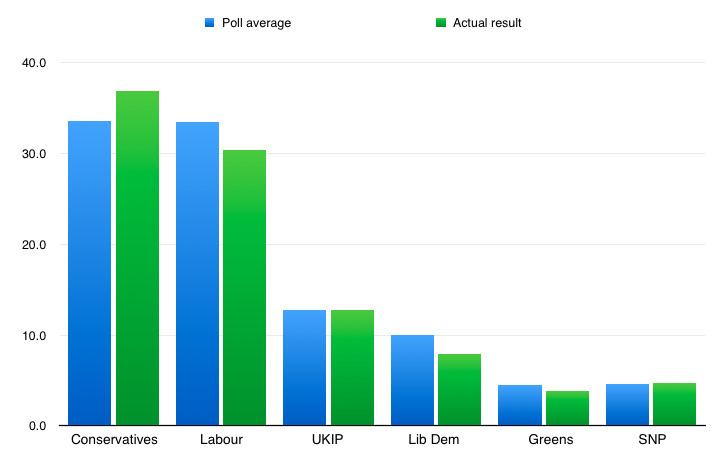
In the event, the actual results proved to be rather different from those indicated by the opinion polls. Opinion polls conducted in the last few months of the campaign, and even in the last few days, had indicated a very close result between the Conservatives and Labour in terms of numbers of votes, suggesting that one of the main parties would have to form a perhaps complex coalition with smaller parties in order to govern.
However the actual results showed a stronger performance by the Conservatives, which gave them an overall majority, since Labour also had a weaker performance than the polls had suggested. When the exit poll was initially presented, some commentators and politicians doubted it, with Paddy Ashdown even declaring "If this poll is correct I will publicly eat my hat on your programme" in response to the apparently poor results for the Liberal Democrats. The exit poll was eventually proved to have in fact overestimated the Liberal Democrats' performance. If the Survation telephone poll (6 May) had been published it would have produced results within 1% of the election results.
The chart shows the relative state of the parties from 13 May 2010 to 7 May 2015, with each line's colour corresponding to a political party: red for the Labour Party, blue for the Conservative Party, purple for the UK Independence Party, yellow for the Liberal Democrats, and green for the combined Green Party of England and Wales and Scottish Green Party. While not shown here, other parties have on occasion polled higher than one or more of the parties represented, for example in the Lord Ashcroft poll conducted on 17–19 April 2015, where the Scottish National Party polled 6% and the Greens 4%. Each dot represents a party's results from an opinion poll displayed in the table below.
Poll results are listed in the table below in reverse chronological order. The highest percentage figure in each polling survey is displayed in bold, and the background shaded in the leading party's colour. The 'party lead' column shows the percentage-point difference between the two parties with the highest figures. In the instance of a tie, no figure is shaded but both are displayed in bold.
Throughout the 2010-2015 parliament, first and second places have without exception alternated between the Conservatives and Labour. The Liberal Democrats and the UK Independence Party have tended to hold either third or fourth place in each individual poll. The combined Green parties of England and Wales and Scotland have most frequently polled fifth and have on occasions polled fourth – level with or ahead of the UK Independence Party or the Liberal Democrats. Included in the 'others' column are other smaller parties, the largest of which (by votes at the 2010 general election) are the British National Party, the Scottish National Party and Plaid Cymru. Detailed poll results that break down 'others' for some dates in 2014 and 2010 are available in a second table, below.
Note: some polls in 2010 did not give an individual figure for the UK Independence Party or the Greens. In these cases, the percentage intending to vote Green and/or UKIP is included with the 'others'.
Polling is conducted in the separate constituent countries of the United Kingdom. Of the 650 seats in the House of Commons, England has 533, Scotland has 59, Wales has 40 and Northern Ireland has 18.
The tables above show poll results just for the five largest parties. Detailed poll results are given below. Often poll companies publish a combined result for SNP and Plaid Cymru, indicated by a merged cell below. Other cases of Party results' not being shown individually are included in the "Others" column, with the individual party's box remaining empty. Results showing <0.5% imply percentages ranging from 0.01% to 0.49%. 0.5% to 1.49% are rounded to 1%.
Each polling organisation uses slightly different methodology in their collection of data; a brief description of each company's methods is as follows:
Angus Reid Public Opinion collects its data through online internet surveys, and demographically weights its data to be representative of the whole population in terms of age, gender, social class, the region of the country lived in and newspaper readership. Past vote weighting is used, and is calculated separately for respondents from Scotland and respondents from England and Wales, whilst those saying they do not know how they will vote are asked which party they are leaning towards, and any responses to this are used as a full response, whilst those still unsure being discounted from the final calculation of levels of party support.
BMG Research is a Birmingham-based social research company which carried out its first political poll from 25 to 27 April 2015 for PoliticsHome, May2015 and the Electoral Reform Society, with the voting intention questions being commissioned by May2015. BMG carries out its fieldwork online and weights for past vote and likelihood to vote with people who did not vote at the previous General Election weighted down by 50%. BMG Research is not a member of the British Polling Council but is applying for membership and abides by BPC rules in carrying out opinion polls. It is recognised by the BPC as a market researcher.
ComRes uses both telephone interviews and online surveys to collect its data; all polls will be conducted using one method exclusively. It is not shown explicitly in the tables in this article whether a particular poll has been conducted by telephone or online but in general those polls with the smaller samples (~1,000) are telephone polls and those with the larger samples (~2,000) were conducted online. The data tables will confirm how the poll was conducted. Whatever the data collection method, all respondents are weighted according to gender, age, social class, household tenure, work status, number of cars owned and whether or not they have taken a foreign holiday in the previous three years. Both telephone and online polls are weighted according to past vote in the last general election, whilst telephone polls also use data from the last 12 ComRes telephone-conducted opinion polls. ComRes compensates for those respondents who says they do not know by asking them instead which party they most clearly identify with, whilst all respondents are weighted according to likelihood to vote on a scale of one to ten, with respondents saying their likelihood of voting is less than four being discounted entirely, and respondents saying their likelihood is more than five being progressively weighted, with a five-out-of-ten likelihood being weighted as half a response and a ten-out-of-ten likelihood being weighted as one whole response.
ICM also collects its data through telephone interviews, and also demographically weights its respondents according to their gender, age, social class, household tenure, work status and the region of the country they live in. It weights respondents according to the levels of support a party received in the previous general election and the last 25 ICM opinion polls and, if a past vote is given, this is used to allocate a response to those who say they do not know how they will vote, although such a response is counted as only half of one whole response. ICM also weights its respondents as to how likely they say they are to vote, with respondents who say they are certain to vote given a higher weighting than those who are not as certain, while if a respondent did not vote at the previous general election, their turnout weighting is automatically reduced by half.
Ipsos MORI collects its data through telephone interviews, and weights its respondents to be demographically representative of gender, age, social class, work status, work sector, household tenure and the region of the country they live in. Data is not weighted according to the way respondents voted at the previous general election, any respondents who say they do not know how they will vote are discounted, and only the responses of people who says they are certain to vote are included in the final calculation of levels of support for each party.
Lord Ashcroft commissions and publishes polls as Lord Ashcroft Polls. On 12 May 2014 he published the first in a series of opinion polls to be published weekly up to the 2015 UK general election. These polls are carried out by telephone, and are past-vote weighted with an allowance for false recall. They are also weighted for likelihood to vote, with a proportion of Don't Knows reallocated to how respondents said they voted at the 2010 general election. The Conservatives, Labour, Liberal Democrats and UKIP are prompted for. Lord Ashcroft does not disclose the organisations which carry out his fieldwork, but states that a number are used. Initially, the methodology of the weekly Ashcroft National Poll was said to be similar to that used by Populus before they moved to polling online. He is not a BPC member; he was initially invited to join but the BPC now states that he is not eligible as he does not work for multiple clients.
Opinium surveys are conducted online via web interviewing, drawing a sample of responses from the company's panel of around 30,000 people. This sample is representative of the adult population of Great Britain in the areas of age, gender, regional location, working status and social grade, as according to the latest Office for National Statistics data. Responses from different demographic groups are handled appropriately to compensate for differential response rates in these different groups.
Populus conducts its surveys over the telephone, and weights all respondents according to gender, age, social class, household tenure, work status, the number of cars they own, and whether they have taken a foreign holiday in the past three years, to be representative of the whole electorate. Respondents are weighted according to their past vote and the levels of support for each party recorded in the previous 20 Populus opinion polls. Respondents who say they do not know how they will vote are allocated according to how they voted at the last general election, at a reduced weighting of 0.5 for previous Conservative or Labour voters and 0.3 for previous Liberal Democrat voters. All respondents are also weighted according to how likely they are to vote, with those certain to vote given the highest weighting.
Survation opinion polling is achieved through online surveys, and all data is weighted to represent the wider population of Great Britain in terms of gender, age, socio-economic group, religion, how the respondent previously voted, and stated likelihood of voting in the next general election. Respondents who are either undecided or refuse to state how they would vote are excluded from the final results, unless they have provided details of how they have voted in the past, in which case, that information is used to adjust the results.
TNS-BMRB interviews a representative sample of adults aged 18+. All interviews are conducted in respondents' homes, although the voting intention data is collected using self-completion methods. The data is weighted twice: firstly to match population totals for age, sex, social grade, working status, presence of children, 2010 voting patterns and region; and secondly, for voting intention questions only, an additional 'likelihood-to-vote' weight is applied.
YouGov collects its data through an online survey, and weights its respondents to be representative of the population as a whole in terms of age, gender, social class, identification with a political party, region of the country and newspaper readership. Respondents are weighted according to how they voted in the previous general election in order to achieve a sample that is reflective of each party's level of support at that election, whilst those respondents who say they do not know who they will vote for are discounted from calculating levels of support for each party.