
 | ||
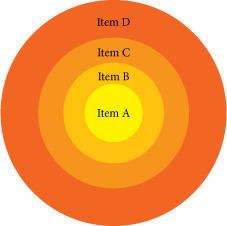
An onion diagram is a kind of chart that shows the dependencies among parts of an organization or process. The chart displays items in concentric circles, where the items in each ring depend on the items in the smaller rings.
Contents
Information
The Onion Diagram is able to show layers of a complete system in a few circles. Each of the circles is able to represent a component that is dependent upon the component on the inside of it shown by the circle inside of it. The main concept of the diagram is shown by the center circle of the diagram. This chart is used due to the fact that it has a clear visual representation that is easy to read, and it has a strong visual impact.
Variations
There is also the Cultural Onion which has seven layers to it including artifacts, behaviors, feelings, values, beliefs, worldview and ultimate allegiance. These layers organize a person's reality and life. The outer most layers are the most accessible while the in-depth ones are only accessible with connections to the person. The seven layers are integrated into three structural levels, which are the foundational, the evaluating, and the actulizing level.1