
 | ||
The Norrington Table is an annual ranking of the colleges of the University of Oxford based on a score computed from the fraction of undergraduate students earning each of the various degree classifications based on that year's final examinations.
Contents
Overview
Currently, the Norrington Table is calculated by awarding 5 points for a student who receives a 1st Class degree, 3 points for a 2:1, 2 for a 2:2 and 1 for a 3rd, divided by the maximum possible score (i.e., the number of finalists in that college multiplied by 5), and expressed as a percentage (rounded to 2 decimal places) per college. Although the difference between the highest places on the table is usually very slight, the top colleges remain very competitive about their rankings on the Table. Their competitiveness has been heightened in recent years by increased media attention on the rankings.
Previously the university had refused to endorse an official table, leading to inaccuracies (see Criticisms below), so the university finally published its own rankings using examination results from all final year undergraduates in 2005.
History of the Norrington Table
Contrary to popular belief, the Norrington Table was not created in 1962 by Sir Arthur Norrington, who was then president of Trinity College. Norrington did not invent the idea of producing a table of the results of Oxford Colleges. Rather, he suggested a refinement to the weightings given to results by a pre-existing table. Norrington's scoring system was suggested in 1963 and abandoned after 1985, owing to changes in the Oxford examination system.
On 5 September 1963, Norrington had a letter published in The Times, in which he objected to the table that their correspondent had invented two days earlier (3 September 1963, p. 12). The Times had previously published a table of Oxford Colleges' results in 1962 (29 August 1962, p. 5).
Norrington wrote: "Your Correspondent has analysed the final examination results this year and gives an order of merit, among the first colleges, based on the percentage of Firsts and Seconds. This, in effect, is the same as basing it on the percentage of Thirds, and gives it no extra credit for Firsts. College A, for example, that gets 20 Firsts, 60 Seconds, and 20 Thirds scores less by this method than College B that gets no Firsts, 81 Seconds and 19 Thirds, but surely A has, in reality, done much better than B. A better result, I submit, is obtained by a points system in which a First scores more than a second and a Second more than a Third. If you make the points 3, 2, and 1 respectively and calculate what percentage of its "possible" each college has secured, you will find that College A, with 200 points out of 300, has scored 66.67 per cent, and B, with 181, only 60 per cent. This method of calculation will be found to promote Magdalen and Merton, which come surprisingly low in your Correspondent's order." (5 September 1963, p. 13)
In 1986, when Oxford for the first time split Second Class honours into Upper Seconds and Lower Seconds, The Times unilaterally adopted the Tompkins Table, which gives more weight to a First class degree: five points for a First, three for a 2.1, two for a 2.2, and one for a Third. This system was invented in 1981 by Peter Tompkins, of Birkenhead, as a method of classifying the results of Cambridge colleges, and a table compiled by Tompkins on this basis was published on 28 August by The Times (28 Aug 1981, p. 10) alongside a table using the Norrington scoring system, which had been compiled by the Cambridge Evening News. The Tompkins Table became the preferred rating for Cambridge colleges and has prevailed for Oxford colleges, too, since 1986.
Recent rankings
Below is the Norrington Table for the academic year 2015/16 along with mean values of the past decade:
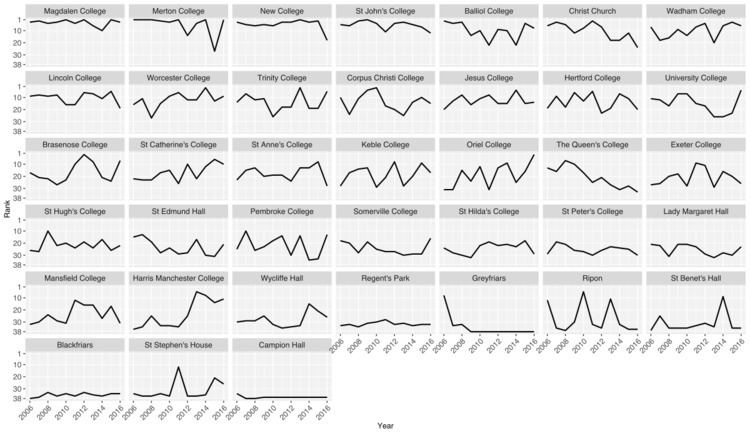
Past rankings
Norrington Table rankings from 2006 to 2016 by college, ordered by mean score (note that Campion Hall hardly ever has any undergraduates):
Criticisms
The table is biased towards colleges which have larger than average numbers of students in science subjects such as chemistry and mathematics, where a higher proportion attain a 1st Class degree compared to arts degrees (where more students attain a 2.1), a feature in respect of which scores are adjusted in the corresponding Tompkins Table at Cambridge.
John Lucas, Fellow of Merton College, Oxford, presented a critique of the Norrington Table in a 1980 article titled "Norrington Blues".