
 | ||
The Nolan Chart is a political spectrum diagram created by David Nolan in 1969. The chart divides human political views into two vectors – economic opinion and personal opinion – to produce a type of Cartesian chart. It expands political view analysis beyond the traditional "left–right" line, which measures politics along a one-dimensional line, into a graph with two dimensions: degrees of economic and personal freedom.
Contents
Development
The claim that political positions can be located on a chart with two axes: left-right (economics) and tough-tender (authoritarian-libertarian) was put forward by the British psychologist Hans Eysenck in his 1954 book The Psychology of Politics with statistical evidence based on survey data. This leads to a loose classification of political positions into four quadrants, with further detail based on exact position within the quadrant.
A similar two-dimensional chart, with eight points instead of four, appeared in 1970 in the publication The Floodgates of Anarchy by Stuart Christie and Albert Meltzer. In Radicals for Capitalism (p. 321), Brian Doherty attributes the idea for the chart to an article by Maurice Bryson and William McDill in The Rampart Journal of Individualist Thought (Summer 1968) entitled "The Political Spectrum: A Bi-Dimensional Approach".
David Nolan first published the current version of the chart in an article named "Classifying and Analyzing Politico-Economic Systems" in the January 1971 issue of The Individualist, the monthly magazine of the Society for Individual Liberty (SIL). In December 1971, he helped to start the group that would become the Libertarian Party.
Frustrated by the "left-right" line analysis that leaves no room for other ideologies, Nolan devised a chart with two axes which would come to be known as the Nolan Chart. The Nolan Chart is the centerpiece of the World's Smallest Political Quiz. Nolan's insight was that the major difference between various political philosophies, the real defining element in what a person believes politically, is the amount of government control over human action that is advocated. Nolan further reasoned that virtually all human political action can be divided into two broad categories: economic and personal. The "economic" category includes what people do as producers and consumers – what they can buy, sell, and produce, where they work, who they hire, and what they do with their money. Examples of economic activity include starting or operating a business, buying a home, constructing a building, and working in an office. The "personal" category includes what people do in relationships, in self-expression, and what they do with their own bodies and minds. Examples of personal activities include whom they marry; choosing what books they read and movies they watch; what foods, medicines, and drugs they choose to consume; recreational activities; religious choices; organizations they join; and with whom they choose to associate.
Since, Nolan realized, most government activity (or government control) occurs in these two major areas, political positions can be defined by how much government control a person or political party favors in these two areas. The extremes are no government at all in either area (anarchism) or total or near-total government control of everything (various forms of totalitarianism). Most political philosophies fall somewhere in between. In broad terms:
In order to visually express this insight, Nolan came up with a two-axis graph. One axis was for economic freedom, and the other was for personal freedom, with the scale on each of the two axes ranging from zero (total state control) to 100% (no state control). 100% freedom in economics would mean a free market; 100% freedom in personal issues would mean no government control of private, personal life. By using the scale on each of the two axes, it was possible to graph the intersection of the amount of personal liberty and economic liberty a person, political organization, or political philosophy advocates. Instead of classifying all political opinion on a one-dimensional range from liberal to conservative, Nolan's chart allowed two-dimensional measurement: how much (or little) government control a person favored in personal and economic matters.
Nolan said that one of the impacts of his chart is that when someone views it, it causes an irreversible change: viewers henceforth view the included orientations in two dimensions instead of one.
In 1987, Marshall Fritz, founder of Advocates for Self-Government, tweaked the chart and added ten questions – which he called the World's Smallest Political Quiz – which enabled people to plot their political beliefs on the chart.
Positions
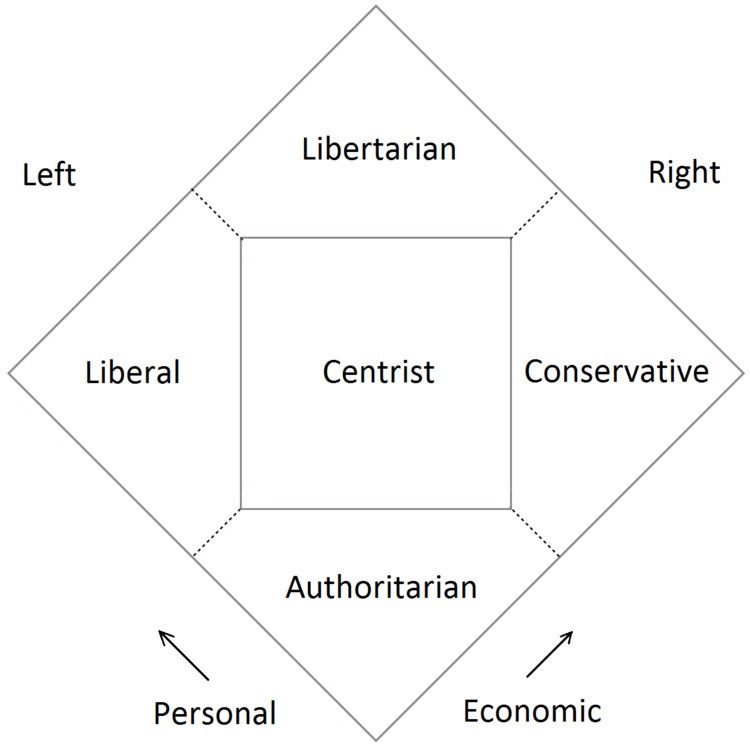
Differing from the traditional "left/right" distinction and other political taxonomies, the Nolan Chart in its original form has two dimensions, with a horizontal x-axis labeled "economic freedom" and a vertical y-axis labeled "personal freedom". It resembles a square divided into four sections, with a label assigned to one of the sections:
Polling
In October 2010, a Gallup survey found five groups of Americans. This poll classified the Americans in "Morality first (17%) Most religious; Keep it small (22%); The bigger, the better (20%); Mushy middle (17%); and Obama liberals (24%), Most heavily Democratic, highest number of liberals".
In August 2011, the libertarian Reason Magazine worked with the Rupe organization to survey 1,200 Americans by telephone and place their views within the Nolan chart categories. The Reason-Rupe poll found that "Americans cannot easily be bundled into either the 'liberal' or 'conservative' groups". Specifically, 28% expressed conservative views, 24% expressed libertarian views, 20% expressed communitarian views, and 28% expressed liberal views. The margin of error was ±3.
Criticism
The Nolan chart is problematic to those who equate economic regulation with personal freedom, and because the libertarian definition of freedom is different from the leftist definition. According to some the chart also implies that the Left is in favor of individual freedoms, however the leftist platform approach to gun control and anti-discrimination laws is not consistent with the chart's definition of freedom. Brian Patrick Mitchell in his book, Eight Ways to Run the Country: A New and Revealing Look at the Left and the Right, gives three reasons for the perception that the chart has a libertarian bias. First, the chart shows no division between the personal and the economic. Second, personal freedoms are defined from different perspectives by the Right and the Left. Third, "the chart is based on a Libertarian definition of freedom not accepted by most Liberals".