
Initial release 2003 Written in C#, Java | Preview release none [±] Available in English | |
 | ||
Developer(s) Ames Research Center (NASA) Stable release 2.1.0 (December 13, 2016; 3 months ago (2016-12-13)) [±] | ||
World Wind is an open-source (released under the NOSA license) virtual globe first developed by NASA in 2003 for use on personal computers and then further developed in concert with the open source community since 2004. As of 2017 a web based version of World Wind is available online, in addition an Android version is also available.
Contents
- Overview
- Add ons and plugins
- World Wind Java
- Tutorials
- Forks and clones
- Datasets available
- Earth
- Moon
- Mars
- Venus
- Jupiter
- Sloan Digital Sky Survey
- Specifications
- References
The original version relied on .NET Framework, which ran only on Microsoft Windows. The more recent Java version, World Wind Java, is cross platform, a software development kit (SDK) aimed at developers and, unlike the old .NET version, not a standalone virtual globe application in the style of Google Earth. The SDK includes a suite of basic demos, available at goworldwind.org. The World Wind Java version was awarded NASA Software of the Year in November 2009. The program overlays NASA and USGS satellite imagery, aerial photography, topographic maps, Keyhole Markup Language (KML) and Collada files.
Overview
Though widely available since 2003, World Wind was released with the NASA Open Source Agreement license in 2004. The latest Java-based version (2.1.0), was released in December 2016. As of 2015 a web based version of World Wind is under development and available online. An Android version is also available.
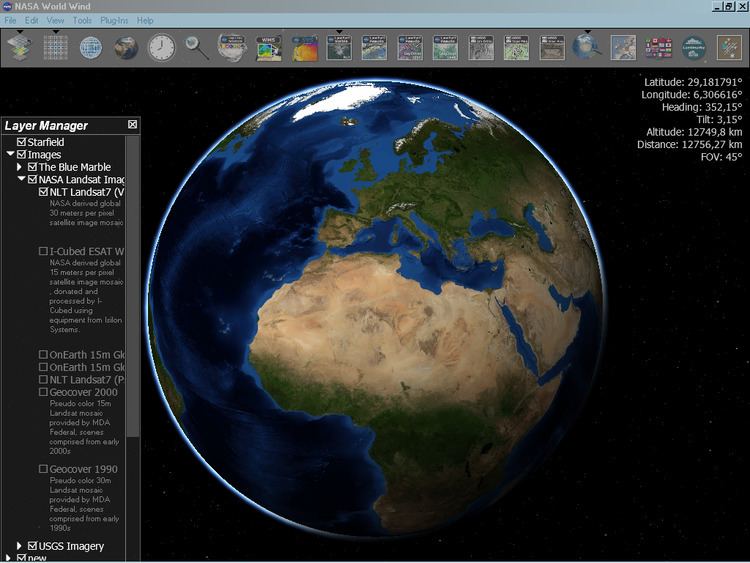
The previous .NET-based version was an application with an extensive suite of plugins. Apart from the Earth there are several worlds: Moon, Mars, Venus, Jupiter (with the four Galilean moons of Io, Ganymede, Europa and Callisto) and SDSS (imagery of stars and galaxies).
Users could interact with the selected planet by rotating it, tilting the view, and zooming in and out. Five million place names, political boundaries, latitude/longitude lines, and other data can be displayed. World Wind.NET provided the ability to browse maps and geospatial data on the internet using the OGC's WMS servers (version 1.4 also uses WFS for downloading place names), import ESRI shapefiles and kml/kmz files. This is an example of how World Wind allows anyone to deliver their data.
Other features of World Wind.NET included support for .X (DirectX 3D polygon mesh) models and advanced visual effects such as atmospheric scattering or sun shading.
The resolution inside the US is high enough to clearly discern individual buildings, houses, cars (USGS Digital Ortho layer) and even the shadows of people (metropolitan areas in USGS Urban Ortho layer). The resolution outside the US is at least 15 meters per pixel.
Microsoft has allowed World Wind to incorporate Virtual Earth high resolution data for non-commercial use.
World Wind uses digital elevation model (DEM) data collected by NASA's Shuttle Radar Topography Mission (SRTM), National Elevation Dataset (NED) and Advanced Spaceborne Thermal Emission and Reflection Radiometer (ASTER). This means one can view topographic features such as the Grand Canyon or Mount Everest in three dimensions. In addition, WW has bathymetry data which allows users to see ocean features, such as trenches and ridges, in 3D.
Many people using the applications are adding their own data and are making them available through various sources, such as the World Wind Central or blogs mentioned in the link section below.
All images and movies created with World Wind using Blue Marble, Landsat, or USGS public domain data can be freely modified, re-distributed, and used on web sites, even for commercial purposes.
Add-ons and plugins
World Wind can be expanded by using one of many add-ons - small extensions that add new functionality to the program.
Possible types of add-ons:
Plugins are small programs written in C#, VB or J# which are loaded and compiled by World Wind at startup. Plug-in developers can add features to World Wind without changing the program's source code.
World Wind Java
The original recipe for World Wind was restricted to Windows, relying on the .NET libraries and DirectX. A new SDK version has been developed in Java with JOGL referred to as World Wind Java. The latest version (2.1.0) was released in December 2016.
This new version has an API-centric architecture with functionalities 'off-loaded' to modular components, leaving the API at the core. This makes World Wind itself a plugin, so that it can be used as interchangeably as possible (for example via Python). This refactoring exercise allows World Wind to be accessed via a browser as a Java Applet. A preview of the World Wind Java SDK was released on May 11, 2007 during Sun Microsystem's annual JavaOne conference.
Since WWj is an SDK, there is no single application; instead there are any number of applications using WWj, each with different functionalities, created by government agencies and commercial developers from around the world. These applications include simple virtual globe viewers, satellite tracker, GIS platforms, photo editor, F-16 simulator, mission planning software and many more.
Tutorials
Forks and clones
Datasets available
Low resolution Blue Marble datasets are included with the initial download; as a user zooms into certain areas, additional high resolution data is downloaded from the NASA servers. The size of all currently available data sets is about 4.6 terabytes.