
 | ||
This article is about the municipal waste generation and treatment in Winnipeg, the capital and largest city of Manitoba, Canada, from 1997 to 2012. The statistical data that are represented show that with the increase in GDP per capita of Winnipeg, waste generation has decreased because of the increased effectiveness of the municipal waste management plan after 2005. It also includes the strategies used by Winnipeg City to treat municipal waste.
Contents
Municipal waste generation
The collection, transportation, processing or disposal and the monitoring of waste is known as waste management. Due to the harmful effects to humans and to the environment as well as its low aesthetic value, it becomes important to manage these wastes. Municipal waste is a challenge to every developed or developing or under developed countries.
The water and waste department of Winnipeg city Municipality has been collecting publishing their data on waste and water for the purpose of sustainable development of the city. They have been collecting data and publishing them since 1996. These data helps them to know the current situation of the city and helps to make the waste management work efficiently.
The data represented covers the period from 1996 to 2012. This data basically covers the garbage and recycle generated by the residential areas of Winnipeg. It excludes the yard waste generated by Winnipeg and is represented in tonnes.
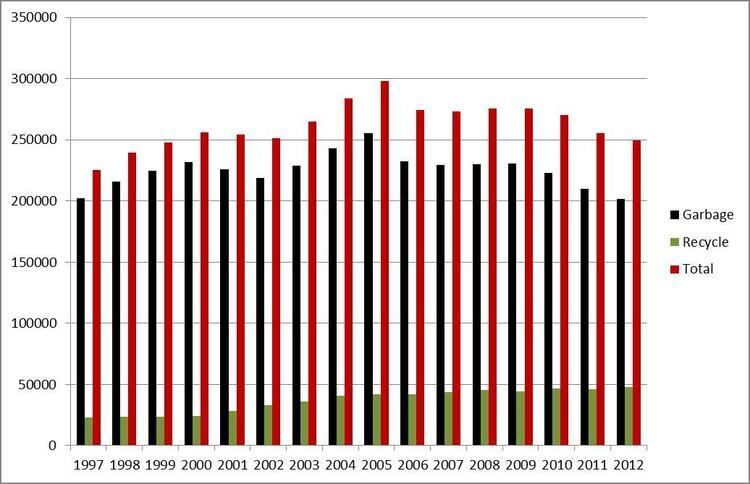
The Figure – 1 shows the municipal waste generated by Winnipeg. This figure contains statistical data from 1997 to 2012. It shows the garbage generation (Black); recycle waste generation (Green) and total waste generation (Red) in Winnipeg. The figure includes the comparison of the waste generation in different years that could help in recognizing the effectiveness of the waste management in this city.
The total waste generated in Winnipeg in 1996 was about 171,117 tonnes with an average of 275 kg per capitaper year, whereas in year 2005 it was remarkably very high very high around 297,848 tonnes. After this the due to better help and programmes regarding the waste management by Winnipeg itself as well as from Manitoba Province, waste management become very effective and its results are seen in the Figure – 1 itself. The waste generated in Winnipeg City in year 2009 was remarkable with the total of 275,291 tonnes which makes an average of 298 kg per year of garbage was generated by each person in Winnipeg. Figure – 2 represents the garbage generated in 2009 consisted of Food waste: 27.9%, Paper: 14.2%, Packaging fiber: 10.7%, other waste (includes furniture, computer equipment, small appliances, and carpeting): 8.7%, Plastics packaging: 7.6%, Renovation waste: 7%, Diapers and sanitary products: 7%, Pet waste: 6.6%, Glass containers: 5%, Textiles: 3%, Metal packaging: 2.8 (Source: Winnipeg Residential Waste Composition Study 2009).
The quantity of residential waste also depends on the season of the years for e.g. Garden trimmings, autumn leaves; clean-up campaigns, summer produce, Christmas residues, etc. are all seasonal in their waste generation. Even type of housing affects the waste generation in the city for e.g. high density areas such produce less waste per capita; whereas apartments produce very little grass and leaves as a waste; also less food waste is generated by the areas with large number of garbage disposal units.
Municipal waste treatment
On October 19, 2011 the Winnipeg City Council approved the master plan of a comprehensive waste management plan requested by the City Council to the Public Service on June 23, 2010 for the entire city to increase the waste diversion rate to 50% or more. This plan would achieve the above-mentioned target by reducing household garbage and by increasing household recycling. This plan was made effective for the municipal waste management by Winnipeg in the first week of October 2012.
The Comprehensive Waste Management Plan is based on three main guiding principles which were established through the Phase – 1 participation process and input from the Stakeholder Advisory Committee. These principles help to shape the goals and objectives of Garbage and Recycling Master Plan (GRMP) that helps to guide potential options for garbage, recycling and organic services in Winnipeg. Those Principles are:
- Sustainability – Environmental, economic and social factors are being considered in the decision-making process under this principle. These factors are in fact intertwined with each other and so are they are needed to be evaluated together – not as three separate parts. Figure – 3.
- Waste Hierarchy – this principle places priority on preventing waste generation (reducing and reusing); maximizing waste diversion (recycling and recovery) and minimizing disposal (residuals). Figure – 4.
- Zero Waste – The Federation of Canadian Municipalities, Defines this as: A community that “has made a long-term commitment to reducing waste through measures such as extended producer responsibility programs, economic instruments to encourage waste reduction, green procurement and product design that includes end-of-life management.
The municipal waste management by Winnipeg City is consistent with the Provincial regulations. A very efficient curb – side collection of recycles to the residential locations is provided by the City of Winnipeg. The figure – 5 shows the residential recycling reports that show that recycling at the residential level in Winnipeg has an 85% of participation rate, which results in diverting approximately 48,087 tonnes of recyclable materials from the waste landfill disposal stream. This tonnage is equivalent to approximately 17% of the waste stream. Recyclables that are collected by the City of Winnipeg from the residential locations includes a standard list of blue box material that includes:
There are also some other programmes that have been undertaken by the City of Winnipeg other than recycle for Waste minimization and diversion. These programmes include Leaf-It Depots, Chin-In Depots, a Backyard Composting programme and Winnipeg also have seven general use recycling depots around the city. The net cost of current recycling programme depends on the market rates for the recycled materials and the level of funding received under Provincial regulation. Over past 15 years, Winnipeg City has recycled more than 700 million kg of waste through the Manitoba Product Stewardship Corporation (MPSC), which pays 80% of the net cost of the recycling service.
The reduction of waste at or near the source of generation is known as Source Reduction of waste and this is one of the most important and promising methods for reduction in the waste generation for the growing waste in Canada. The Source Separated Organics (SSO) also counts under the treatments of municipal waste figure–6 and under source reduction techniques. This treatment helps in minimizing the waste in other words SSO is used for diverting solid wastes form the landfills. These SSO have been comprises about 1/ 3 to ½ of the total residential waste of Winnipeg. SSO includes materials like kitchen waste, yard waste, etc. and Winnipeg did about 53% of total (kitchen + yard waste) of composting that includes 24% of Kitchen waste and 68% of Yard waste. This SSO are separated from the undesirable materials that are then sent to the curb – side Collection as a separate residual waste stream.
The City of Winnipeg is evaluating new technologies and processes for resource recover, such as thermal oxidation, carbonizing, aerobic digestion, pelletizing, and organic waste management. The decomposition of organic waste releases methane gas, and landfills consisting of organic waste generate methane gas, known for its harmful effects on the environment as a greenhouse gas (GHG). National statistics indicate that 4% of total GHG emissions are generated from the landfills. The City of Winnipeg uses this gas as a resource recovery opportunity at the Brady Landfill site figure – 8 and uses this gas as a source of energy to displace natural gas or to produce electricity.
The City of Winnipeg does organic material processing and energy recovery by using aerobic digestion – one of the methods for managing organic waste. With appropriate conditions and proper use of the technology, the SSO can provide us a feedstock for renewable energy production and be a source of quality compost material. Aerobic digestion and aerobic composting are same kind or related kind of processing options. Figure–7
Municipal waste generation and economic development in Winnipeg
The statistics in shown in Table shown below is the Data representation of waste generation and economic development of Winnipeg City and this shows the municipal Waste Generation, Population and Real GDP of the City. Here Real GDP is used as an economic growth indicator of the City.
In Winnipeg, in year 1997, the population of the City was approximately 618,477 whereas the real GDP of the City was approximately 19,340 million $ at the same time the waste generation of the City was 225,149 tonnes/yr. with an average of 330.24 kg/per capita/ yr. The same parameters for year 2001were population 619544, real GDP was 21,517 and at the same time the waste generation in the City was 254,334 tons/yr. with an average of 372.41 kg/per capita/yr.
According to table-1 faced maximum waste generation in year 2006, with a population of 633,451 with real GDP of 24,035million $ and at the same time the waste generation of 274,355 tons/yr. with an average of 392.91 kg/per capita/yr. this data clearly shows that the City of Winnipeg was facing the challenge of increasing population, increasing GDP but at the same time increase in waste generation of Winnipeg. Not only table-1 but figure 1 also shows the same thing.
Hence after realizing the challenge, the City of Winnipeg increased its Waste Management efficiency and the results are represented in table-1 and figure-1. In the year 2011, the City of Winnipeg was efficient enough to reduce the waste generation of the city even though there was increase in the population with the increase in the economy of the City.