
 | ||
Microscale thermophoresis (MST) is a technology for the interaction analysis of biomolecules. Microscale thermophoresis is the directed movement of particles in a microscopic temperature gradient. Any change of the hydration shell of biomolecules due to changes in their structure/conformation results in a relative change of the movement along the temperature gradient and is used to determine binding affinities. MST allows measurement of interactions directly in solution without the need of immobilization to a surface (immobilization-free technology).
Contents
Applications
Affinity
Thermodynamic parameters
Additional information
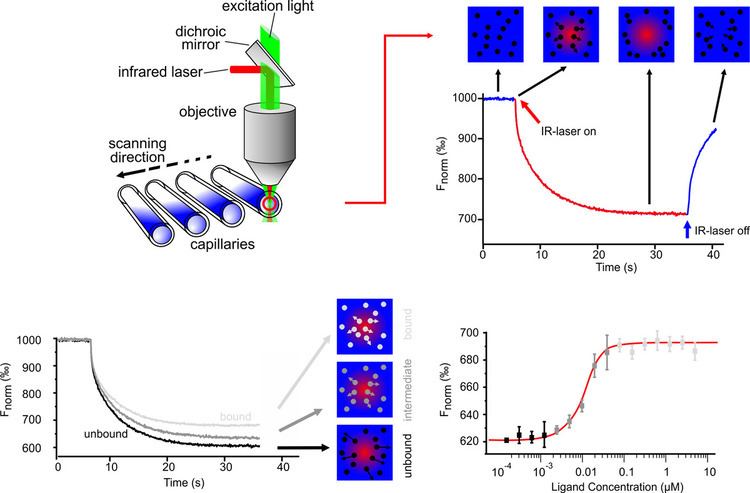
Technology
MST is based on the directed movement of molecules along temperature gradients, an effect termed thermophoresis. A spatial temperature difference ΔT leads to a depletion of molecule concentration in the region of elevated temperature, quantified by the Soret coefficient ST: chot/ccold = exp(-ST ΔT)
Thermophoresis depends on the interface between molecule and solvent. Under constant buffer conditions, thermophoresis probes the size, charge and solvation entropy of the molecules. The thermophoresis of a fluorescently labeled molecule A typically differs significantly from the thermophoresis of a molecule-target complex AT due to size, charge and solvation entropy differences. This difference in the molecule's thermophoresis is used to quantify the binding in titration experiments under constant buffer conditions.
The thermophoretic movement of the fluorescently labelled molecule is measured by monitoring the fluorescence distribution F inside a capillary. The microscopic temperature gradient is generated by an IR-Laser, which is focused into the capillary and is strongly absorbed by water. The temperature of the aqueous solution in the laser spot is raised by up to ΔT=5 K. Before the IR-Laser is switched on a homogeneous fluorescence distribution Fcold is observed inside the capillary. When the IR-Laser is switched on, two effects, separated by their time-scales, contribute to the new fluorescence distribution Fhot. The thermal relaxation time is fast and induces a binding-dependent drop in the fluorescence of the dye due to its local environmental-dependent response to the temperature jump. On the slower diffusive time scale (10 s), the molecules move from the locally heated region to the outer cold regions. The local concentration of molecules decreases in the heated region until it reaches a steady-state distribution.
While the mass diffusion D dictates the kinetics of depletion, ST determines the steady-state concentration ratio chot/ccold=exp(-ST ΔT) ≈ 1-ST ΔT under a temperature increase ΔT. The normalized fluorescence Fnorm=Fhot/Fcold measures mainly this concentration ratio, in addition to the temperature jump ∂F/∂T. In the linear approximation we find: Fnorm=1+(∂F/∂T-ST)ΔT. Due to the linearity of the fluorescence intensity and the thermophoretic depletion, the normalized fluorescence from the unbound molecule Fnorm(A) and the bound complex Fnorm(AT) superpose linearly. By denoting x the fraction of molecules bound to targets, the changing fluorescence signal during the titration of target T is given by: Fnorm=(1-x) Fnorm(A)+x Fnorm(AT).
Quantitative binding parameters are obtained by using a serial dilution of the binding substrate. By plotting Fnorm against the logarithm of the different concentrations of the dilution series, a sigmoidal binding curve is obtained. This binding curve can directly be fitted with the nonlinear solution of the law of mass action, with the dissociation constant KD as result.