
 | ||
Mathematical visualization is an aspect of geometry which allows one to understand and explore mathematical phenomena via visualization. Classically this consisted of two-dimensional drawings or building three-dimensional models (particularly plaster models in the 19th and early 20th century), while today it most frequently consists of using computers to make static two or three dimensional drawings, animations, or interactive programs. Writing programs to visualize mathematics is an aspect of computational geometry.
Contents
The power of mathematical visualization the great courses
Applications
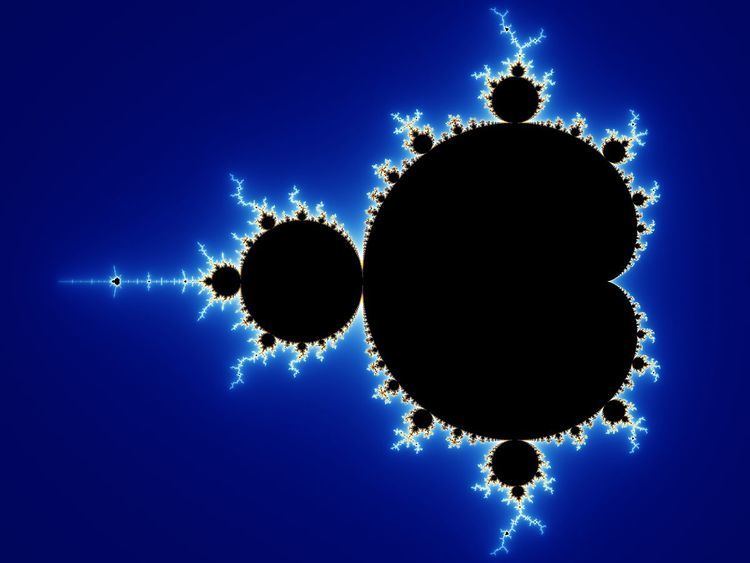
Mathematical visualization is used throughout mathematics, particularly in the fields of geometry and analysis. Notable examples include plane curves, space curves, polyhedra, ordinary differential equations, partial differential equations (particularly numerical solutions, as in fluid dynamics or minimal surfaces such as soap films), conformal maps, fractals, and chaos.
Examples
The cover of the journal The Notices of the American Mathematical Society regularly features a mathematical visualization.