
 | ||
A mass chromatogram is a representation of mass spectrometry data as a chromatogram, where the x-axis represents time and the y-axis represents signal intensity. The source data contains mass information; however, it is not graphically represented in a mass chromatogram in favor of visualizing signal intensity versus time. The most common use of this data representation is when mass spectrometry is used in conjunction with some form of chromatography, such as in liquid chromatography-mass spectrometry or gas chromatography-mass spectrometry. In this case, the x-axis represents retention time, analogous to any other chromatogram. The y-axis represents signal intensity or relative signal intensity. There are many different types of metrics that this intensity may represent, depending on what information is extracted from each mass spectrum.
Contents
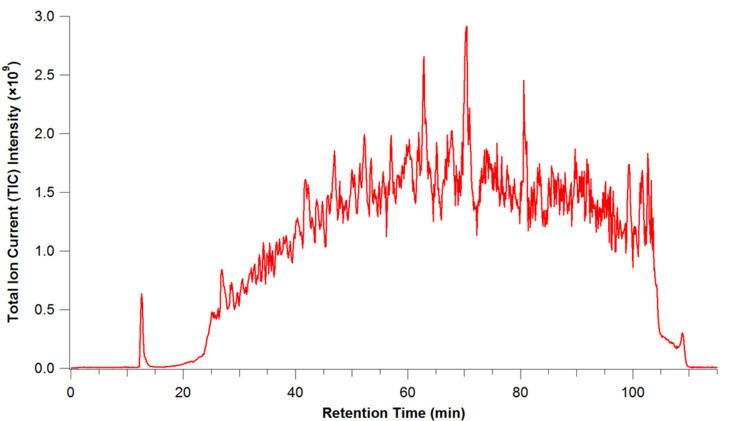
Total ion current (TIC) chromatogram
The total ion current (TIC) chromatogram represents the summed intensity across the entire range of masses being detected at every point in the analysis. The range is typically several hundred mass-to-charge units or more. In complex samples, the TIC chromatogram often provides limited information as multiple analytes elute simultaneously, obscuring individual species.
Base peak chromatogram
The base peak chromatogram is similar to the TIC chromatogram, however it monitors only the most intense peak in each spectrum. This means that the base peak chromatogram represents the intensity of the most intense peak at every point in the analysis. Base peak chromatograms often have a cleaner look and thus are more informative than TIC chromatograms because the background is reduced by focusing on a single analyte at every point.
Extracted-ion chromatogram (XIC)
In an extracted-ion chromatogram (XIC or EIC), also called a reconstructed-ion chromatogram (RIC), one or more m/z values representing one or more analytes of interest are recovered ('extracted') from the entire data set for a chromatographic run. The total intensity or base peak intensity within a mass tolerance window around a particular analyte's mass-to-charge ratio is plotted at every point in the analysis. The size of the mass tolerance window typically depends on the mass accuracy and mass resolution of the instrument collecting the data. This is useful for re-examining data to detect previously-unsuspected analytes, to highlight potential isomers, resolve suspected co-eluting substances, or to provide clean chromatograms of compounds of interest. Extracted-ion chromatograms are created via a data-mining or data-analysis process; selected-ion chromatograms, discussed below, arise from a completely different type of experiment, i.e., one in which data is collected only for specific m/z values representing compounds or compound types of interest.
Selected-ion monitoring chromatogram (SIM)
A selected-ion monitoring (SIM) chromatogram is similar to an XIC, with the exception that the mass spectrometer is operated in SIM mode, such that only a selected m/z value (or more) is/are detected in the analysis. SIM experiments can be performed using mass spectrometry (MS) or tandem mass spectrometry (MS/MS) instruments. They are more common on MS instruments. This differs significantly from the extracted-ion chromatogram mentioned above in that only data for the ion(s) of interest are collected in a SIM experiment; for extracted-ion chromatograms, data for an entire mass range are collected during the run and then examined for analytes of interest after the completion of the run.
Selected-reaction monitoring chromatogram
The selected-reaction monitoring (SRM) experiment is very similar to the SIM experiment except that tandem mass spectrometry is used and a specific product ion of a specific parent ion is detected. The mass of the parent analyte is first selected while other ions are filtered away. The parent analyte ion is then fragmented in the gas phase and a specific fragment ion is monitored. This experiment has very high specificity because the SRM chromatogram represents only ions of a particular mass that fragment in a manner that produce a very specific product mass. This type of experiment can only be performed using tandem mass spectrometry.