
Abbreviation MAP Region served Global | Headquarters Oxford, UK Official language English | |
 | ||
Formation May 1, 2006; 10 years ago (2006-05-01) Purpose Determining spatial limits of Plasmodium falciparum and Plasmodium vivax malaria at a global scale and its endemicity within this range | ||
The Malaria Atlas Project, abbreviated as MAP, is a non-profit project funded primarily by the Bill and Melinda Gates Foundation, the Medical Research Council and the Wellcome Trust. MAP is hosted within the Division of Mathematical, Physical, and Life Sciences (MPLS) within the University of Oxford. MAP aims to disseminate free, accurate and up-to-date information on malaria and associated topics, organised on a geographical basis. The work of MAP falls into three areas:
Contents
- History
- Modelling malaria prevalence
- Plasmodium falciparum prevalence maps
- Plasmodium vivax prevalence maps
- WHO World Malaria Reports
- Ongoing data curation
- References
The MAP team have assembled a unique spatial database on linked information derived from medical intelligence, satellite-derived climate data to constrain the limits of malaria transmission, and the largest ever archive of community-based estimates of parasite prevalence. These data have been assembled and analysed by a team of geographers, statisticians, epidemiologists, biologists and public health specialists. Furthermore, where these data have been cleared for release, they are available via a data explorer tool on the MAP website.
History
MAP was founded by Bob Snow and Simon Hay in 2005 to fill the niche for the malaria control community at a global scale. Since 2012, it has been led by Peter Gething, Dave Smith, Catherine Moyes and Simon Hay. The initial focus of MAP centred on predicting the endemicity of Plasmodium falciparum, the most deadly form of the malaria parasite, due to its global epidemiological significance and its better prospects for elimination and control. Work in 2009 began to map the extent and burden of the relatively neglected Plasmodium vivax.
The Repository for Open Access Data from the Malaria Atlas Project (ROAD-MAP) was established by Catherine Moyes, Simon Hay and Bob Snow in 2011. Since 2014, it has been led by Peter Gething and Mike Thorn.
Modelling malaria prevalence
A key aspect of MAP’s work is to use statistical approaches to modelling the prevalence of different forms of malaria on a global scale using Bayesian model-based geostatistics.
Various environmental factors are known to affect malaria prevalence. Malaria prevalence is known to vary in a relatively predictable fashion in space and time, and observed malaria prevalence depends heavily on people’s age and intervention coverage.
In spatial epidemiology, it is common to find that very few measurements have been taken in large parts of the geographical region of interest. The available measurements may be error-prone or incompletely reported, and almost always it is a subset of the local population that has been surveyed.
Since 2005, MAP has collated an extensive database of survey data from a variety of sources. These surveys are typically clustered at village level and record data on parasite positivity rates, usually determined by rapid diagnostic blood tests. Additionally, MAP has gathered extensive data on covariates such as temperature suitability and land cover. These factors affect the distribution of the mosquito vectors responsible for spreading malaria.
The benefit of using Bayesian model-based geostatistics is that it conveys the spatially varying level of uncertainty associated with the mapped surface.
The probability that any of the very many individual (candidate) maps is the single correct map is small, so it is not useful to report the single most likely map. Taken together, however, the candidate maps make it possible to compute the probability of correctness of statements about the map, such as Plasmodium falciparum endemicity at location x in 2010 was between 0.1 and 0.3".
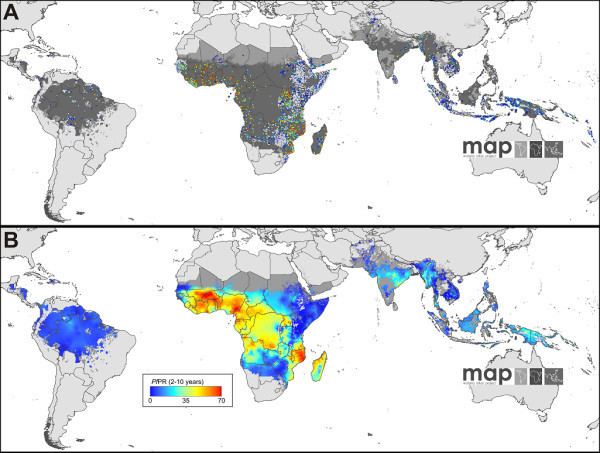
Plasmodium falciparum prevalence maps
Since the year 2000, a concerted campaign against malaria has led to unprecedented levels of intervention coverage across sub-Saharan Africa. Future control planning depends on understanding the effect of this effort. However, the effect of malaria interventions across the varied epidemiological settings of Africa remains poorly understood owing to the absence of reliable surveillance data and the simplistic approaches underlying current disease estimates.
In September 2015, research by MAP published in Nature quantified the attributable effect of malaria disease control efforts in Africa. The results showed Plasmodium falciparum infection prevalence in endemic Africa halved and the incidence of clinical disease fell by 40% between 2000 and 2015. The best estimate is that interventions have averted 663 million clinical cases since 2000. Insecticide-treated nets, the most widespread intervention, were by far the largest contributor. Although still below target levels, current malaria interventions have substantially reduced malaria disease incidence across the continent.
Plasmodium vivax prevalence maps
In 2012, MAP published the first global maps for Plasmodium vivax endemicity.
WHO World Malaria Reports
The MAP team works in collaboration with the World Health Organization (WHO) to provide the prevalence estimates for sub-Saharan African countries for the annual World Malaria Report. Additionally, MAP aids the WHO in production of the annual prevalence rates maps in the World Malaria Report.
Ongoing data curation
The MAP database is the biggest source of processed malariometric data available.
By April 2015, the MAP database contained:
MAP actively seeks out and curates a wide variety of additional data from different sources, including the following:
MAP is committed to the free and open dissemination of this data (where permission has been granted by the data owner to release it). Dissemination of data is facilitated via the main MAP webpage and the Explorer tool. The latter allows users to download tabular data on malaria by countries.