
 | ||
At the start of the 19th century, the leading newspaper was the Morning Post, which sold around 4,000 copies per day, twice the sales of its nearest rival. As production methods improved, print runs increased, and newspapers were sold at lower prices. By 1828, the Morning Herald was selling the most copies, but it was soon overtaken by The Times.
Contents
Pubs would typically take in one or two papers for their customers to read, and through this method, by the 1850s the newspaper of the licensed trade, the Morning Advertiser, had the second highest circulation. Sales of The Times were around 40,000, and it had around 80% of the entire daily newspaper market, but Sunday papers were more popular, some boasting sales of more than 100,000. Later in the century, the Daily News came to prominence, selling 150,000 copies a day in the 1870s, while by 1890, The Daily Telegraph had a circulation of 300,000. Sunday newspaper sales also grew rapidly, with Lloyd's Weekly Newspaper being the first to sell one million copies an issue.
The press was changed by the introduction of halfpenny papers. The first national halfpenny paper was the Daily Mail (followed by the Daily Express and the Daily Mirror), which became the first weekday paper to sell one million copies around 1911. Circulation continued to increase, reaching a peak in the mid-1950s; sales of the News of the World reached a peak of more than eight million in 1950. Since the 1950s, there has been a gradual decline in newspaper sales. The availability of multimedia news platforms has accelerated this decline in the 21st century, and by the close of 2014, no UK newspaper had a daily circulation exceeding two million. The overall circulation of newspapers declined by 6.6% in 2014–15.
2010 to present
Figures shown are average circulations for January of each year. Only newspapers with circulations of more than 100,000 copies per day in January 2012 are listed. Regardless of immediate source, all figures originate from the Audit Bureau of Circulations.
2000–2009
Figures shown are average circulations for January of each year. Only newspapers with circulations of more than 100,000 copies per day in January 2009 are listed. Regardless of immediate source, all figures originate from the Audit Bureau of Circulations.
1950–1999
Figures shown are average circulations for each year. Figures originate from the Audit Bureau of Circulations.
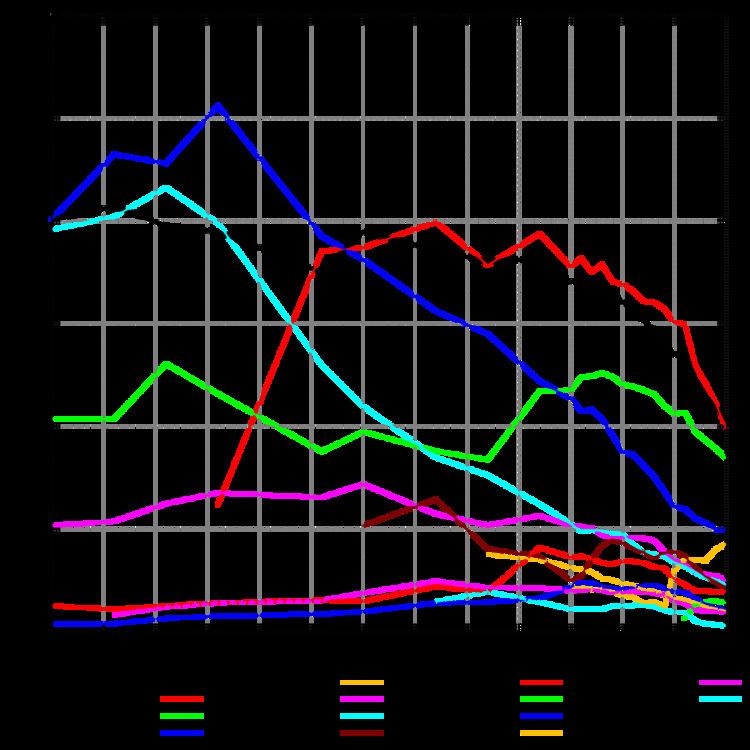
Before 1950
Figures shown are average circulations for each year. Figures from after 1931 originate from the Audit Bureau of Circulations;those from 1852 and 1838 originate from stamp duty returns. Those from 1910, 1921 and 1930 are the most uncertain and rely on information originating from T. B. Browne's Advertiser's ABC.
2010 to present
Figures shown are average circulations for January of each year. Only newspapers with circulations of more than 100,000 copies in January 2010 are listed. Regardless of immediate source, all figures originate from the Audit Bureau of Circulations.
2000–2009
Figures shown are average circulations for January of each year. Only newspapers with circulations of more than 100,000 copies in January 2009 are listed. Regardless of immediate source, all figures originate from the Audit Bureau of Circulations.
20th century
Figures shown are average circulations for each year. Figures originate from the Audit Bureau of Circulations.
19th century
Figures shown are average circulations for each year. Figures originate from stamp duty returns.
Regional newspapers
Figures shown are average circulations for each year. Figures originate from the Audit Bureau of Circulations.