
 | ||
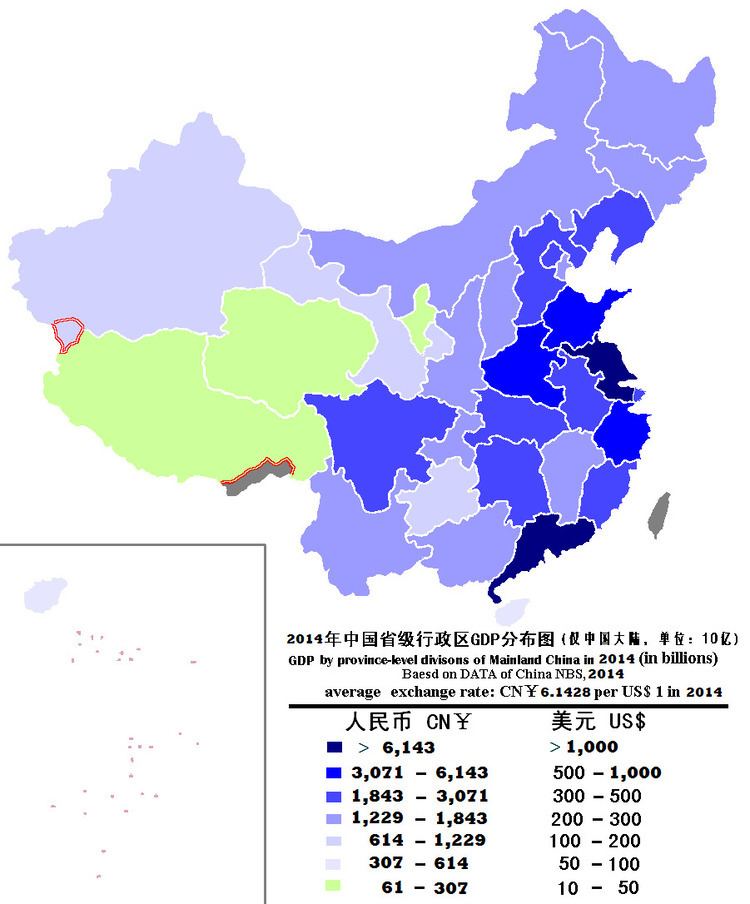
The article lists China's province-level divisions by gross domestic product (GDP). Each province's GDP is listed in both the national currency renminbi (CN¥), and at nominal US dollar values according to annual average exchange rates and according to purchasing power parity (PPP). Historical figures and rankings, including purchasing power parity (PPP) figures, are also given for main years since 1978. Figures for Hong Kong and Macau, which are special administrative regions of the PRC but do not use the same currency, are listed after the main list for comparative purposes.
Contents
All the CN¥ figures are from the National Bureau of Statistics of China. Annual PPP rates are taken from the International Monetary Fund's World Economic Outlook databases.
Historical GDP data in main years
The tables below list China's provinces and territories by their estimated GDP in main fiscal years since 1978. Their respective ranks and shares of China's total GDP are also shown.
Appendix
GDP figures for Hong Kong and Macau SARs are given in both US dollars and in their respective local currencies (Hong Kong dollars and Macanese patacas). PPP figures are given in Int'l. dollars; to enable easy comparison, the following lists Taiwan Area Historical GDP.